Exploratory Band Regression
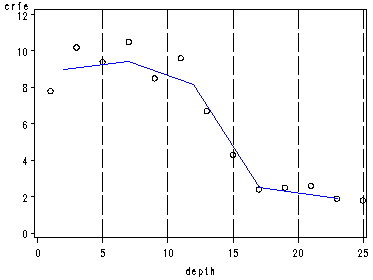
page 146 Figure 5.1 Exploratory band regression curve (5 bands) based on cross-medians from Table 5.1, using the crfe data set.
data crfe1;
 set crfe;
 Observation=_n_;
 if 1<=observation<=2 then band=1;
 if 3<=observation<=5 then band=2;
 if 6<=observation<=7 then band=3;
 if 8<=observation<=10 then band=4;
 if 11<=observation<=13 then band=5;
run;
proc means data=crfe1 p50;
 output out=crfe2;
 class band;
 var depth crfe;
 run;
The MEANS ProcedureN band Obs Variable 50th Pctl ———————————————– 1 2 depth 2.0000000 crfe 9.0000000
2 3 depth 7.0000000 crfe 9.4000000
3 2 depth 12.0000000 crfe 8.1500000
4 3 depth 17.0000000 crfe 2.5000000
5 3 depth 23.0000000 crfe 1.9000000 ———————————————–
We use ods trace on/off to see what SAS is creating.
proc means data=crfe1 p50;
 class band;
 var depth crfe;
 ods output Summary=sum;
run;
The MEANS ProcedureN band Obs Variable 50th Pctl ———————————————– 1 2 depth 2.0000000 crfe 9.0000000
2 3 depth 7.0000000 crfe 9.4000000
3 2 depth 12.0000000 crfe 8.1500000
4 3 depth 17.0000000 crfe 2.5000000
5 3 depth 23.0000000 crfe 1.9000000 ———————————————–
data crfe3;
 merge sum crfe1;
 by band;
run;
symbol1 v=circle c=black;
symbol2 v=none c=blue i=join l=1;
axis1 order=(0 to 25 by 5) minor=none;
axis2 order=(0 to 12 by 2) minor=none;
proc gplot data=crfe3;
 plot crfe*depth=1 crfe_P50*depth_P50=2 / overlay href=5 10 15 20 25 lhref=22
 haxis=axis1 vaxis=axis2;
run;
quit;
Figure 5.1
page 147 Table 5.1 Cross-medians for exploratory regression with five bands: Ratio of chromium (Cr) to iron (Fe) in Great Bay sediments.
proc print data=crfe3;
 var depth crfe depth_P50 crfe_P50;
run;
Choosing Transformations
page 155 Table 5.2 Curvilinear regression – water-use regression with transformed variables.
We will be using the concord1 data set. First, we need to change retire from a string to a numeric variable.
data concy;
  set concord1;
  retired = .;
  if retire = 'yes' then retired = 1;
  if retire = 'no' then retired = 0;
run;
data concyt;
 set concy;
 twtr81=(water81)**.3;
 tincome=(income)**.3;
 twtr80=(water80)**.3;
 logp81=log(peop81);
 logcpeop=log(peop81/peop80);
run;
proc reg data=concyt;
 model twtr81=tincome twtr80 educat retired logp81 logcpeop;
run;
quit;
The REG Procedure Model: MODEL1 Dependent Variable: twtr81Analysis of Variance
Sum of Mean Source DF Squares Square F Value Pr > F
Model 6 1310.11714 218.35286 209.51 <.0001 Error 489 509.63662 1.04220 Corrected Total 495 1819.75376
Root MSE 1.02088 R-Square 0.7199 Dependent Mean 9.77698 Adj R-Sq 0.7165 Coeff Var 10.44170
Parameter Estimates
Parameter Standard Variable DF Estimate Error t Value Pr > |t|
Intercept 1 1.85626 0.38493 4.82 <.0001 tincome 1 0.51572 0.12972 3.98 <.0001 twtr80 1 0.62550 0.02908 21.51 <.0001 educat 1 -0.03613 0.01601 -2.26 0.0245 retired 1 0.10139 0.11899 0.85 0.3946 logp81 1 0.71468 0.11049 6.47 <.0001 logcpeop 1 0.91569 0.26274 3.49 0.0005
Evaluating Consequences of Transformations
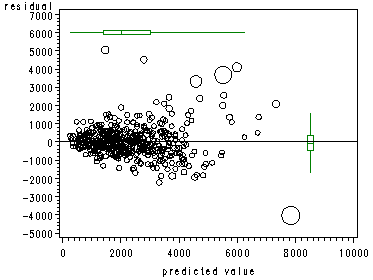
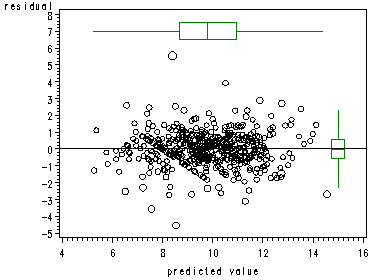
page 156 Figure 5.7 e-versus-y-hat plots with points proportional to scaled Cook’s D, for raw-data (top) and transformed-variables (bottom) regressions.
proc reg data=concy;
 model water81 = income water80 educat retired peop81 cpeop peop80;
 output out=out1(keep=case e d) residual=e cookd=d;
run;
quit;
The REG Procedure Model: MODEL1 Dependent Variable: water81Analysis of Variance
Sum of Mean Source DF Squares Square F Value Pr > F
Model 6 740477522 123412920 171.08 <.0001 Error 489 352761188 721393 Corrected Total 495 1093238710
Root MSE 849.34859 R-Square 0.6773 Dependent Mean 2298.38710 Adj R-Sq 0.6734 Coeff Var 36.95411
NOTE: Model is not full rank. Least-squares solutions for the parameters are not unique. Some statistics will be misleading. A reported DF of 0 or B means that the estimate is biased. NOTE: The following parameters have been set to 0, since the variables are a linear combination of other variables as shown.
peop80 = peop81 – cpeop
Parameter Estimates
Parameter Standard Variable DF Estimate Error t Value Pr > |t|
Intercept 1 242.22043 206.86382 1.17 0.2422 income 1 20.96699 3.46372 6.05 <.0001 water80 1 0.49194 0.02635 18.67 <.0001 educat 1 -41.86552 13.22031 -3.17 0.0016 retired 1 189.18433 95.02142 1.99 0.0470 peop81 B 248.19702 28.72480 8.64 <.0001 cpeop B 96.45360 80.51903 1.20 0.2315 peop80 0 0 . . .
proc univariate data=out1;
 var e;
run;
The UNIVARIATE Procedure Variable: e (Residual)Moments
N 496 Sum Weights 496 Mean 0 Sum Observations 0 Std Deviation 844.185326 Variance 712648.864 Skewness 1.18637008 Kurtosis 6.77888563 Uncorrected SS 352761188 Corrected SS 352761188 Coeff Variation . Std Error Mean 37.9050401
Basic Statistical Measures
Location Variability
Mean 0.0000 Std Deviation 844.18533 Median -69.4956 Variance 712649 Mode 22.7855 Range 9075 Interquartile Range 814.02638
Tests for Location: Mu0=0
Test -Statistic- —–p Value——
Student’s t t 0 Pr > |t| 1.0000 Sign M -18 Pr >= |M| 0.1160 Signed Rank S -4887 Pr >= |S| 0.1261
Quantiles (Definition 5)
Quantile Estimate
100% Max 5037.9871 99% 3315.5848 95% 1367.2257 90% 906.9871 75% Q3 365.3865 50% Median -69.4956 25% Q1 -448.6399 10% -828.8270 5% -1212.3343 1% -1870.9171 0% Min -4037.0471
The UNIVARIATE Procedure Variable: e (Residual)
Extreme Observations
——Lowest—– —–Highest—–
Value Obs Value Obs
-4037.05 94 3315.58 118 -2224.40 494 3687.12 125 -1938.20 163 4112.44 124 -1883.80 133 4512.28 80 -1870.92 362 5037.99 85
proc reg data=concy;
 model water81 = income water80 educat retired peop81 cpeop peop80;
 output out=out2(keep=case yhat) predicted=yhat;
run;
quit;
The REG Procedure Model: MODEL1 Dependent Variable: water81Analysis of Variance
Sum of Mean Source DF Squares Square F Value Pr > F
Model 6 740477522 123412920 171.08 <.0001 Error 489 352761188 721393 Corrected Total 495 1093238710
Root MSE 849.34859 R-Square 0.6773 Dependent Mean 2298.38710 Adj R-Sq 0.6734 Coeff Var 36.95411
NOTE: Model is not full rank. Least-squares solutions for the parameters are not unique. Some statistics will be misleading. A reported DF of 0 or B means that the estimate is biased. NOTE: The following parameters have been set to 0, since the variables are a linear combination of other variables as shown.
peop80 = peop81 – cpeop
Parameter Estimates
Parameter Standard Variable DF Estimate Error t Value Pr > |t|
Intercept 1 242.22043 206.86382 1.17 0.2422 income 1 20.96699 3.46372 6.05 <.0001 water80 1 0.49194 0.02635 18.67 <.0001 educat 1 -41.86552 13.22031 -3.17 0.0016 retired 1 189.18433 95.02142 1.99 0.0470 peop81 B 248.19702 28.72480 8.64 <.0001 cpeop B 96.45360 80.51903 1.20 0.2315 peop80 0 0 . . .
proc univariate data=out2;
 var yhat;
run;
The UNIVARIATE Procedure Variable: yhat (Predicted Value of water81)Moments
N 496 Sum Weights 496 Mean 2298.3871 Sum Observations 1140000 Std Deviation 1223.07571 Variance 1495914.19 Skewness 1.02246077 Kurtosis 1.53522546 Uncorrected SS 3360638812 Corrected SS 740477522 Coeff Variation 53.214522 Std Error Mean 54.9177205
Basic Statistical Measures
Location Variability
Mean 2298.387 Std Deviation 1223 Median 2024.846 Variance 1495914 Mode 1252.343 Range 7574 Interquartile Range 1643
Tests for Location: Mu0=0
Test -Statistic- —–p Value——
Student’s t t 41.85147 Pr > |t| <.0001 Sign M 248 Pr >= |M| <.0001 Signed Rank S 61628 Pr >= |S| <.0001
Quantiles (Definition 5)
Quantile Estimate
100% Max 7837.047 99% 6242.199 95% 4425.504 90% 3884.347 75% Q3 3036.301 50% Median 2024.846 25% Q1 1392.983 10% 902.298 5% 649.121 1% 359.403 0% Min 262.776
The UNIVARIATE Procedure Variable: yhat (Predicted Value of water81)
Extreme Observations
——Lowest—– —–Highest—–
Value Obs Value Obs
262.776 100 6242.20 232 296.707 424 6697.20 194 345.901 375 6736.44 451 353.493 366 7321.02 62 359.403 330 7837.05 94
data concordall5;
 merge concord1 out1 out2;
 by case;
 label e = 'residual';
 label yhat = 'predicted value';
 label d = 'Cooks D';
data outc5;
 set concordall5;
 if d<=1 then d1=(99/4)*d*(d+1)**2+1;
 else d1=100;
run;
The following code is needed to draw the boxplots. We will begin with the horizontal boxplot.
data anno_outc7;
length function color $8;
retain xsys ysys '2' size 1 color 'green';
 function='move'; x=262.776; y=6000; output; *begin left line;
 function='draw'; x=1392.983; y=6000; output; *end left line;
 function='poly'; x=1392.983; y=6100; output; *upper left corner of box;
 function='polycont'; x=1392.983; y=5900; output; *lower left corner;
 function='polycont'; x=3036.301; y=5900; output; *lower right corner of box;
 function='polycont'; x=3036.301; y=6100; output; *upper right corner of box;
 function='polycont'; x=1392.983; y=6100; output; *back to upper left corner;
 function='move'; x=2024.846; y=6100; output; *middle line of box;
 function='draw'; x=2024.846; y=5900; output;
 function='move'; x=3036.301; y=6000; output; *begin right line;
 function='draw'; x=6242.199; y=6000; output; *end right line;
* to draw the vertical boxplot ;
 function='move'; x=8500; y=1586.42607; output; *begin top line;
 function='draw'; x=8500; y=365.3865; output; *end top line;
 function='poly'; x=8400; y=365.3865; output; *upper left corner of box;
 function='polycont'; x=8600; y=365.3865; output; *upper right corner;
 function='polycont'; x=8600; y=-448.6399; output; *lower right corner of box;
 function='polycont'; x=8400; y=-448.6399; output; *lower left corner;
 function='polycont'; x=8400; y=365.3865; output; *back to upper left;
 function='move'; x=8400; y=-69.4956; output; *middle line of box;
 function='draw'; x=8600; y=-69.4956; output;
 function='move'; x=8500; y=-448.6399; output; *begin bottom line;
 function='draw'; x=8500; y=-1669.67947; output; *end bottom line;
run;
symbol1 color=black interpol=r value=circle height=1;
axis1 order=(-5000 to 7000 by 1000);
axis2 order=(0 to 10000 by 2000);
proc gplot data=outc5;
 bubble e*yhat=d1 / anno=anno_outc7 bsize=20 vref=0 haxis=axis2 vaxis=axis1;
run;
quit;
Figure 5.7 (top)
Code for bottom graph
proc reg data=concyt;
 model twtr81=tincome twtr80 educat retired logp81 logcpeop;
 output out=outt1(keep=case e d) residual=e cookd=d;
run;
quit;
The REG Procedure Model: MODEL1 Dependent Variable: twtr81Analysis of Variance
Sum of Mean Source DF Squares Square F Value Pr > F
Model 6 1310.11714 218.35286 209.51 <.0001 Error 489 509.63662 1.04220 Corrected Total 495 1819.75376
Root MSE 1.02088 R-Square 0.7199 Dependent Mean 9.77698 Adj R-Sq 0.7165 Coeff Var 10.44170
Parameter Estimates
Parameter Standard Variable DF Estimate Error t Value Pr > |t|
Intercept 1 1.85626 0.38493 4.82 <.0001 tincome 1 0.51572 0.12972 3.98 <.0001 twtr80 1 0.62550 0.02908 21.51 <.0001 educat 1 -0.03613 0.01601 -2.26 0.0245 retired 1 0.10139 0.11899 0.85 0.3946 logp81 1 0.71468 0.11049 6.47 <.0001 logcpeop 1 0.91569 0.26274 3.49 0.0005
proc univariate data=outt1;
 var e;
run;
The UNIVARIATE Procedure Variable: e (Residual)Moments
N 496 Sum Weights 496 Mean 0 Sum Observations 0 Std Deviation 1.01467676 Variance 1.02956893 Skewness 0.09215428 Kurtosis 3.05691796 Uncorrected SS 509.636619 Corrected SS 509.636619 Coeff Variation . Std Error Mean 0.04556033
Basic Statistical Measures
Location Variability
Mean 0.000000 Std Deviation 1.01468 Median 0.027486 Variance 1.02957 Mode 0.192232 Range 10.09369 Interquartile Range 1.14222
Tests for Location: Mu0=0
Test -Statistic- —–p Value——
Student’s t t 0 Pr > |t| 1.0000 Sign M 6 Pr >= |M| 0.6214 Signed Rank S 513 Pr >= |S| 0.8726
Quantiles (Definition 5)
Quantile Estimate
100% Max 5.5425267 99% 2.5855824 95% 1.5112894 90% 1.1586173 75% Q3 0.5838978 50% Median 0.0274864 25% Q1 -0.5583203 10% -1.2199819 5% -1.6533702 1% -2.7004427 0% Min -4.5511665
The UNIVARIATE Procedure Variable: e (Residual)
Extreme Observations
——Lowest—– —–Highest—–
Value Obs Value Obs
-4.55117 175 2.58558 385 -3.57222 105 2.71060 125 -3.11979 494 2.89063 118 -2.72492 67 3.91849 80 -2.70044 31 5.54253 85
proc reg data=concyt;
 model twtr81 = tincome twtr80 educat retired logp81 logcpeop;
 output out=outt2(keep=case yhat) predicted=yhat;
run;
quit;
The REG Procedure Model: MODEL1 Dependent Variable: twtr81Analysis of Variance
Sum of Mean Source DF Squares Square F Value Pr > F
Model 6 1310.11714 218.35286 209.51 <.0001 Error 489 509.63662 1.04220 Corrected Total 495 1819.75376
Root MSE 1.02088 R-Square 0.7199 Dependent Mean 9.77698 Adj R-Sq 0.7165 Coeff Var 10.44170
Parameter Estimates
Parameter Standard Variable DF Estimate Error t Value Pr > |t|
Intercept 1 1.85626 0.38493 4.82 <.0001 tincome 1 0.51572 0.12972 3.98 <.0001 twtr80 1 0.62550 0.02908 21.51 <.0001 educat 1 -0.03613 0.01601 -2.26 0.0245 retired 1 0.10139 0.11899 0.85 0.3946 logp81 1 0.71468 0.11049 6.47 <.0001 logcpeop 1 0.91569 0.26274 3.49 0.0005
proc univariate data=outt2;
 var yhat;
run;
The UNIVARIATE Procedure Variable: yhat (Predicted Value of twtr81)Moments
N 496 Sum Weights 496 Mean 9.77698219 Sum Observations 4849.38317 Std Deviation 1.62686856 Variance 2.6467013 Skewness -0.0449142 Kurtosis -0.2134845 Uncorrected SS 48722.45 Corrected SS 1310.11714 Coeff Variation 16.6397823 Std Error Mean 0.07304855
Basic Statistical Measures
Location Variability
Mean 9.776982 Std Deviation 1.62687 Median 9.772759 Variance 2.64670 Mode 8.241130 Range 9.28923 Interquartile Range 2.28434
Tests for Location: Mu0=0
Test -Statistic- —–p Value——
Student’s t t 133.8422 Pr > |t| <.0001 Sign M 248 Pr >= |M| <.0001 Signed Rank S 61628 Pr >= |S| <.0001
Quantiles (Definition 5)
Quantile Estimate
100% Max 14.55009 99% 13.63465 95% 12.31429 90% 11.77718 75% Q3 10.93542 50% Median 9.77276 25% Q1 8.65108 10% 7.55329 5% 7.03800 1% 6.13424 0% Min 5.26086
The UNIVARIATE Procedure Variable: yhat (Predicted Value of twtr81)
Extreme Observations
——Lowest—– —–Highest—–
Value Obs Value Obs
5.26086 330 13.6346 232 5.35334 424 13.8889 194 5.74989 375 13.9873 451 5.80417 396 14.1229 62 6.13424 407 14.5501 94
data concordallt5;
 merge concyt outt1 outt2;
 by case;
 label e = 'residual';
 label yhat = 'predicted value';
 label d = 'Cooks D';
data outct5;
 set concordallt5;
 if d<=1 then d1=(99/4)*d*(d+1)**2+1;
 else d1=100;
run;
data anno_outct7;
length function color $8;
retain xsys ysys '2' size 1 color 'green';

* to draw the horizontal boxplot ;

 function='move'; x=5.2249; y=7; output; *begin left line;
 function='draw'; x=8.6510; y=7; output; *end left line;
 function='poly'; x=8.6510; y=7.5; output; *upper left corner of box;
 function='polycont'; x=8.6510; y=6.5; output; *lower left corner;
 function='polycont'; x=10.9354; y=6.5; output; *lower right corner of box;
 function='polycont'; x=10.9354; y=7.5; output; *upper right corner;
 function='polycont'; x=8.6510; y=7.5; output; *back to the upper left corner;
 function='move'; x=9.7728; y=7.5; output; *middle line of box;
 function='draw'; x=9.7728; y=6.5; output;
 function='move'; x=10.9354; y=7; output; *begin right line;
 function='draw'; x=14.36191; y=7; output; *end right line;
* to draw the vertical boxplot ;
 function='move'; x=15; y=2.29732; output; *begin top line;
 function='draw'; x=15; y=.5839; output; *end top line;
 function='poly'; x=14.75; y=.5839; output; *upper left corner of box;
 function='polycont'; x=15.25; y=.5839; output; *upper right corner;
 function='polycont'; x=15.25; y=-.5583; output; *lower right corner of box;
 function='polycont'; x=14.75; y=-.5583; output; *lower left corner;
 function='polycont'; x=14.75; y=.5839; output; *back to upper left corner;
 function='move'; x=14.75; y=-.0275; output; *middle line of box;
 function='draw'; x=15.25; y=-.0275; output;
 function='move'; x=15; y=-.5583; output; *begin bottom line;
 function='draw'; x=15; y=-2.27163; output; *end bottom line;
run;
symbol1 color=black interpol=r value=circle height=1;
axis1 order=(-5 to 8 by 1);
axis2 order=(4 to 16 by 2);
proc gplot data=outct5;
 bubble e*yhat=d1 / anno=anno_outct7 bsize=20 vref=0 haxis=axis2 vaxis=axis1;
run;
quit;
Figure 5.71 (bottom)
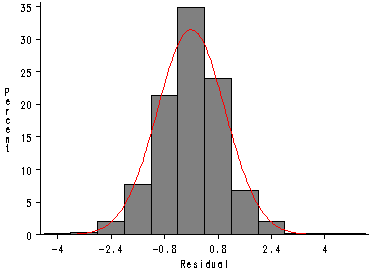
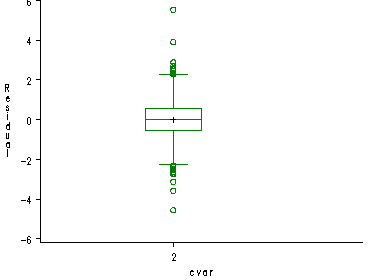
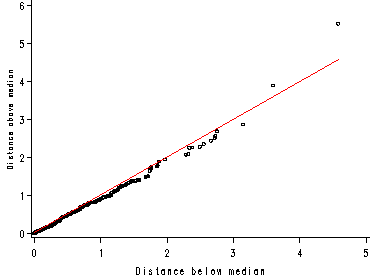
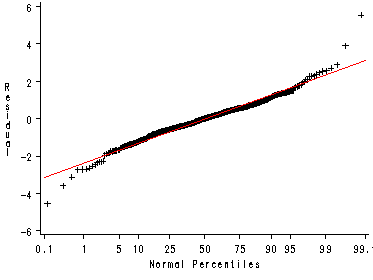
page 157 Figure 5.8 Distribution of residuals from transformed-variables regression.
proc reg data=concyt;
 model twtr81 = tincome twtr80 educat retired logp81 logcpeop;
 output out=out30(keep=case e) residual=e;
run;
quit;
The REG Procedure Model: MODEL1 Dependent Variable: twtr81Analysis of Variance
Sum of Mean Source DF Squares Square F Value Pr > F
Model 6 1310.11714 218.35286 209.51 <.0001 Error 489 509.63662 1.04220 Corrected Total 495 1819.75376
Root MSE 1.02088 R-Square 0.7199 Dependent Mean 9.77698 Adj R-Sq 0.7165 Coeff Var 10.44170
Parameter Estimates
Parameter Standard Variable DF Estimate Error t Value Pr > |t|
Intercept 1 1.85626 0.38493 4.82 <.0001 tincome 1 0.51572 0.12972 3.98 <.0001 twtr80 1 0.62550 0.02908 21.51 <.0001 educat 1 -0.03613 0.01601 -2.26 0.0245 retired 1 0.10139 0.11899 0.85 0.3946 logp81 1 0.71468 0.11049 6.47 <.0001 logcpeop 1 0.91569 0.26274 3.49 0.0005
proc univariate data=out30 noprint;
 var e;
 histogram / noframe normal(color=red) cfill=grey midpoints=-4 to 5 by .80;
run;
The UNIVARIATE Procedure Fitted Distribution for eParameters for Normal Distribution
Parameter Symbol Estimate
Mean Mu 0 Std Dev Sigma 1.014677
Goodness-of-Fit Tests for Normal Distribution
Test —Statistic—- —–p Value—–
Kolmogorov-Smirnov D 0.05666612 Pr > D <0.010 Cramer-von Mises W-Sq 0.37254684 Pr > W-Sq <0.005 Anderson-Darling A-Sq 2.45369344 Pr > A-Sq <0.005
Quantiles for Normal Distribution
——Quantile—— Percent Observed Estimated
1.0 -2.70044 -2.360491 5.0 -1.65337 -1.668995 10.0 -1.21998 -1.300361 25.0 -0.55832 -0.684389 50.0 0.02749 -0.000000 75.0 0.58390 0.684389 90.0 1.15862 1.300361 95.0 1.51129 1.668995 99.0 2.58558 2.360491
Unlike Stata that uses the bin option to determine the size of the bins of the histogram, SAS asks for the midpoints of the bins. That is the purpose of the midpoints option shown above.
Figure 5.8 histogram
data concz30;
 set out30;
cvar=2;
proc boxplot data=concz30;
 plot e*cvar / boxstyle=schematic
 cboxes=green idsymbol=circle noframe boxwidth=15 vaxis=-6 to 6 by 2;
run;
Figure 5.8 boxplot
proc reg data=concyt;
 model twtr81 = tincome twtr80 educat retired logp81 logcpeop;
 output out=out331(keep=case e) residual=e;
run;
quit;
proc univariate data=out331 noprint;
var e;
output out = stats31 median = med81 n = n81 ;
data stats32;
set stats31; evodd81 = mod(n81,2);
/* even/odd flag */
call symput('evodd81',evodd81);
call symput('med81',med81);
call symput('n81',n81);
proc sort data=out331
out=sorted381(keep=e);
by e;
data above381(drop=b) below381(drop=a);
set sorted381; i = _n_;
/* n is even */
if evodd81 = 0 then do;
if i <= &n81 / 2 then do;
b = &med81 - e; output below381;
end;
else do;
a = e - &med81;
output above381;
end;
end;
/* n is odd */
else do;
if i <= (&n81 + 1)/2 then do;
b = &med81 - e; output below381;
end;
if i >= (&n81 + 1)/2 then do;
a = e - &med81; output above381;
end;
end;
proc sort data=above381;
by descending i;
data ab3;
merge above381 below381;
/* n is even */
if &evodd81 = 0 then do;
if i = 1 then x = min(a,b);
else if i = &n81 / 2 then x = max(a,b); y=x;
end;
/* n is odd */
else do;
if i = 1 then x = min(a,b);
else if i = (&n81 + 1)/2 then x = max(a,b);
y=x;
end;
axis1 order=(0 to 6 by 1) label=(angle=90 height=.75 'Distance above median');
axis2 order=(0 to 5 by 1) label=('Distance below median');
symbol1 interpol=none value=circle color=black height=.5; symbol2 interpol=join value=none color=red;
proc gplot data=ab3; plot a*b y*x /
vaxis=axis1 vminor=0 /* vertical axis */
haxis=axis2 hminor=0 /* horizontal axis */
noframe overlay;
run;
quit;
The REG Procedure Model: MODEL1 Dependent Variable: twtr81Analysis of Variance
Sum of Mean Source DF Squares Square F Value Pr > F
Model 6 1310.11714 218.35286 209.51 <.0001 Error 489 509.63662 1.04220 Corrected Total 495 1819.75376
Root MSE 1.02088 R-Square 0.7199 Dependent Mean 9.77698 Adj R-Sq 0.7165 Coeff Var 10.44170
Parameter Estimates
Parameter Standard Variable DF Estimate Error t Value Pr > |t|
Intercept 1 1.85626 0.38493 4.82 <.0001 tincome 1 0.51572 0.12972 3.98 <.0001 twtr80 1 0.62550 0.02908 21.51 <.0001 educat 1 -0.03613 0.01601 -2.26 0.0245 retired 1 0.10139 0.11899 0.85 0.3946 logp81 1 0.71468 0.11049 6.47 <.0001 logcpeop 1 0.91569 0.26274 3.49 0.0005
Figure 5.8 symmetry plot
proc univariate data=out331 noprint;
  var e;
  probplot / normal(mu=est sigma=est color=red) noframe;
run;
quit;
Figure 5.8 quantile-normal plot
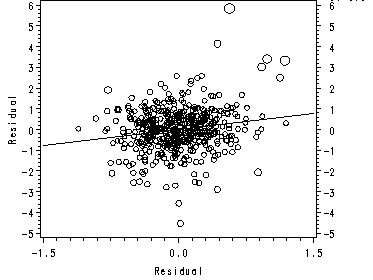
page 157 Figure 5.9 Proportional leverage plot for transformed-variables regression: 1981 water use versus income.
data concyt;
 set concy;
 twater81=(water81)**.3;
 tincome=(income)**.3;
 twater80=(water80)**.3;
 lpeop81=log(peop81);
 lcpeop=log(peop81/peop80);
run;
proc reg data=concyt;
  model twater81 = twater80 educat retired lpeop81 lcpeop;
  output out=out511 (keep=case yres) residual=yres;
run;
quit;
The REG Procedure Model: MODEL1 Dependent Variable: twater81Analysis of Variance
Sum of Mean Source DF Squares Square F Value Pr > F
Model 5 1293.64488 258.72898 240.97 <.0001 Error 490 526.10888 1.07369 Corrected Total 495 1819.75376
Root MSE 1.03619 R-Square 0.7109 Dependent Mean 9.77698 Adj R-Sq 0.7079 Coeff Var 10.59827
Parameter Estimates
Parameter Standard Variable DF Estimate Error t Value Pr > |t|
Intercept 1 2.58987 0.34288 7.55 <.0001 twater80 1 0.64756 0.02898 22.35 <.0001 educat 1 -0.01515 0.01534 -0.99 0.3240 retired 1 -0.03688 0.11550 -0.32 0.7496 lpeop81 1 0.77938 0.11092 7.03 <.0001 lcpeop 1 0.94933 0.26654 3.56 0.0004
proc reg data=concyt;
  model tincome = twater80 educat retired lpeop81 lcpeop;
  output out=out512 (keep=case xres) residual=xres;
run;
quit;
The REG Procedure Model: MODEL1 Dependent Variable: tincomeAnalysis of Variance
Sum of Mean Source DF Squares Square F Value Pr > F
Model 5 37.02296 7.40459 58.58 <.0001 Error 490 61.93346 0.12639 Corrected Total 495 98.95642
Root MSE 0.35552 R-Square 0.3741 Dependent Mean 2.47500 Adj R-Sq 0.3677 Coeff Var 14.36447
Parameter Estimates
Parameter Standard Variable DF Estimate Error t Value Pr > |t|
Intercept 1 1.42249 0.11764 12.09 <.0001 twater80 1 0.04277 0.00994 4.30 <.0001 educat 1 0.04070 0.00526 7.73 <.0001 retired 1 -0.26811 0.03963 -6.77 <.0001 lpeop81 1 0.12546 0.03806 3.30 0.0010 lcpeop 1 0.06522 0.09145 0.71 0.4761
data both500;
 merge out511 out512;
run;
proc reg data=both500;
  model yres=xres;
  output out=out513 (keep=case d) cookd=d;
run;
quit;
The REG Procedure Model: MODEL1 Dependent Variable: yres ResidualAnalysis of Variance
Sum of Mean Source DF Squares Square F Value Pr > F
Model 1 16.47227 16.47227 15.97 <.0001 Error 494 509.63662 1.03165 Corrected Total 495 526.10888
Root MSE 1.01570 R-Square 0.0313 Dependent Mean -2.2576E-15 Adj R-Sq 0.0293 Coeff Var -4.49903E16
Parameter Estimates
Parameter Standard Variable Label DF Estimate Error t Value Pr > |t|
Intercept Intercept 1 -2.0019E-15 0.04561 -0.00 1.0000 xres Residual 1 0.51572 0.12906 4.00 <.0001
data both502;
 set out513;
 if d<=1 then d1=((99/4)*d*(d+1)**2)+1;
 else d1=100;
run;
data both501;
  merge both500 both502;
  by case;
run;
symbol1 i=r;
axis2 label=(a=90 r=0);
axis1 order=(-1.5 to 1.5 by 1.5);
proc gplot data=both501;
 plot yres*xres=1 /haxis=axis1 vaxis=axis2;
  bubble2 yres*xres=d1 / bsize=20 haxis=axis1;
run;
quit;
Figure 5.9
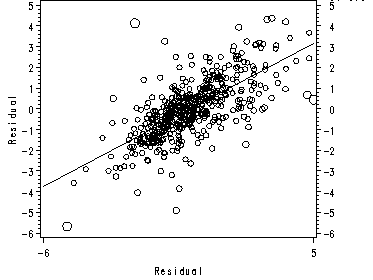
page 158 Figure 5.10 Proportional leverage plot for transformed-variables regression: 1981 versus 1980 water use.
data concyt;
 set concy;
 twater81=(water81)**.3;
 tincome=(income)**.3;
 twater80=(water80)**.3;
 lpeop81=log(peop81);
 lcpeop=log(peop81/peop80);
run;
proc reg data=concyt;
  model twater81 = tincome educat retired lpeop81 lcpeop;
  output out=out5112 (keep=case yres) residual=yres;
run;
quit;
The REG Procedure Model: MODEL1 Dependent Variable: twater81Analysis of Variance
Sum of Mean Source DF Squares Square F Value Pr > F
Model 5 828.01240 165.60248 81.82 <.0001 Error 490 991.74136 2.02396 Corrected Total 495 1819.75376
Root MSE 1.42266 R-Square 0.4550 Dependent Mean 9.77698 Adj R-Sq 0.4495 Coeff Var 14.55112
Parameter Estimates
Parameter Standard Variable DF Estimate Error t Value Pr > |t|
Intercept 1 5.94918 0.46628 12.76 <.0001 tincome 1 1.04798 0.17745 5.91 <.0001 educat 1 -0.03879 0.02231 -1.74 0.0827 retired 1 -0.06735 0.16546 -0.41 0.6842 lpeop81 1 1.84297 0.13551 13.60 <.0001 lcpeop 1 -0.00535 0.36125 -0.01 0.9882
proc reg data=concyt;
  model twater80 = tincome educat retired lpeop81 lcpeop;
  output out=out5122 (keep=case xres) residual=xres;
run;
quit;
The REG Procedure Model: MODEL1 Dependent Variable: twater80Analysis of Variance
Sum of Mean Source DF Squares Square F Value Pr > F
Model 5 768.52448 153.70490 61.12 <.0001 Error 490 1232.20682 2.51471 Corrected Total 495 2000.73130
Root MSE 1.58578 R-Square 0.3841 Dependent Mean 10.29697 Adj R-Sq 0.3778 Coeff Var 15.40048
Parameter Estimates
Parameter Standard Variable DF Estimate Error t Value Pr > |t|
Intercept 1 6.54341 0.51975 12.59 <.0001 tincome 1 0.85094 0.19780 4.30 <.0001 educat 1 -0.00425 0.02487 -0.17 0.8644 retired 1 -0.26977 0.18443 -1.46 0.1442 lpeop81 1 1.80380 0.15104 11.94 <.0001 lcpeop 1 -1.47248 0.40267 -3.66 0.0003
data both5002;
 merge out5112 out5122;
run;
proc reg data=both5002;
  model yres=xres;
  output out=out5132 (keep=case d) cookd=d;
run;
quit;
The REG Procedure Model: MODEL1 Dependent Variable: yres ResidualAnalysis of Variance
Sum of Mean Source DF Squares Square F Value Pr > F
Model 1 482.10474 482.10474 467.31 <.0001 Error 494 509.63662 1.03165 Corrected Total 495 991.74136
Root MSE 1.01570 R-Square 0.4861 Dependent Mean -1.2346E-14 Adj R-Sq 0.4851 Coeff Var -8.22678E15
Parameter Estimates
Parameter Standard Variable Label DF Estimate Error t Value Pr > |t|
Intercept Intercept 1 -2.3115E-15 0.04561 -0.00 1.0000 xres Residual 1 0.62550 0.02894 21.62 <.0001
data both5022;
 set out5132;
 if d<=1 then d1=((99/4)*d*(d+1)**2)+1;
 else d1=100;
run;
data both5012;
  merge both5002 both5022;
  by case;
run;
symbol1 i=r;
axis2 label=(a=90 r=0);
axis1 order=(-6 to 6 by 11);
proc gplot data=both5012;
 plot yres*xres=1 /haxis=axis1 vaxis=axis2;
  bubble2 yres*xres=d1 / bsize=20 haxis=axis1;
run;
quit;
Figure 5.10
Conditional Effect Plots
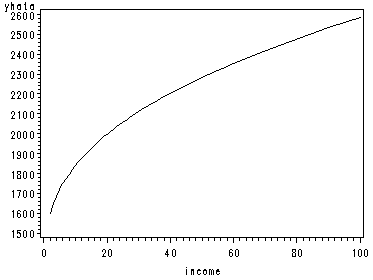
page 160 Figure 5.11 Conditional effect plot showing curvilinear relation between 1981 water use and income, with other X variables at means.
data cont;
 set concy;
 yhat1=8.507+.516*(income**.3);
 yhata=yhat1**(1/.3);
run;
proc sort data=cont;
 by yhata;
run;
symbol1 color=black interpol=join;
axis1 order=(0 to 100 by 20);
proc gplot data=cont;
 plot yhata*income=1 / haxis=axis1;
run;
quit;
Figure 5.11
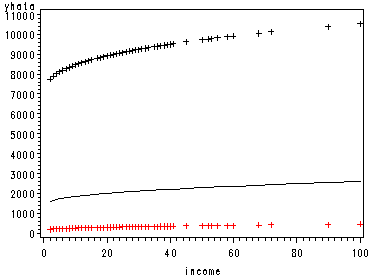
page 161 Figure 5.12 Conditional effect plot with three levels of other X variables.
Top curve
data cont1;
 set concy;
 yhat2=14.046+.516*(income)**.3;
 yhatb=yhat2**(1/.3);
run;
proc sort data=cont1;
 by yhatb;
run;
Bottom curve
data cont2;
 set concy;
 yhat3=4.204+.516*(income)**.3;
 yhatc=yhat3**(1/.3);
run;
proc sort data=cont2;
 by yhatc;
run;
data cont3;
 merge cont cont1 cont2;
 by income;
run;
symbol1 color=black interpol=join;
axis1 order=(0 to 100 by 20);
proc gplot data=cont3;
 plot yhata*income yhatb*income yhatc*income / overlay haxis=axis1;
run;
quit;
Figure 5.12
Comparing Effects
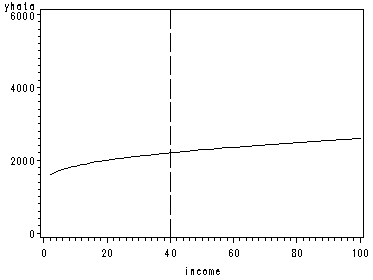
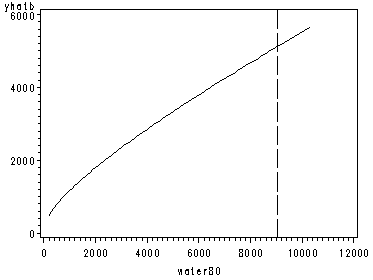
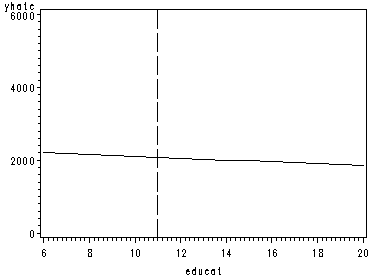
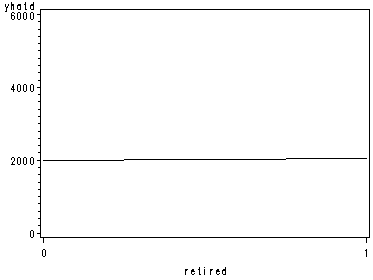
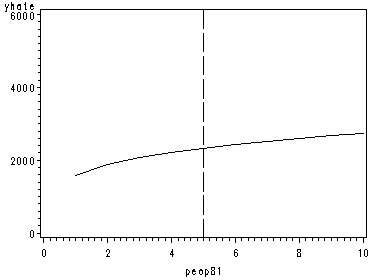
page 162 Figure 5.13 Conditional effect plots for X variables of Equation [5.13], each with other X variables at means.
data con1;
 set concy;
 yhat1=8.507+.516*((income)**.3);
 yhata=yhat1**(1/.3);
run;
proc sort data=con1;
 by yhata;
run;
symbol1 color=black interpol=join;
axis1 order=(0 to 100 by 20);
axis2 order=(0 to 6000 by 2000);
proc gplot data=con1;
 plot yhata*income / href=40 lhref=22 haxis=axis1 vaxis=axis2;
run;
quit;
data con2;
 set concy;
 yhat2=3.338+.626*((water80)**.3);
 yhatb=yhat2**(1/.3);
run;
proc sort data=con2;
 by yhatb;
run;
symbol1 color=black interpol=join;
axis1 order=(0 to 12000 by 2000);
axis2 order=(0 to 6000 by 2000);
proc gplot data=con2;
 plot yhatb*water80 / href=9050 lhref=22 haxis=axis1 vaxis=axis2;
run;
quit;
data con3;
 set concy;
 yhat3=10.288-.036*(educat);
 yhatc=yhat3**(1/.3);
run;
proc sort data=con3;
 by yhatc;
run;
symbol1 color=black interpol=join;
axis1 order=(6 to 20 by 2);
axis2 order=(0 to 6000 by 2000);
proc gplot data=con3;
 plot yhatc*educat / href=11 lhref=22 haxis=axis1 vaxis=axis2;
run;
quit;
data con4;
 set concy;
 yhat4=9.755+.101*(retired);
 yhatd=yhat4**(1/.3);
run;
proc sort data=con4;
 by yhatd;
run;
symbol1 color=black interpol=join;
axis1 order=(0 1);
axis2 order=(0 to 6000 by 2000);
proc gplot data=con4;
 plot yhatd*retired / haxis=axis1 vaxis=axis2;
run;
quit;
data con5;
 set concy;
 yhat5=9.087+.715*(log(peop81));
 yhate=yhat5**(1/.3);
run;
proc sort data=con5;
 by yhate;
run;
symbol1 color=black interpol=join;
axis1 order=(0 to 10 by 2);
axis2 order=(0 to 6000 by 2000);
proc gplot data=con5;
 plot yhate*peop81 / href=5 lhref=22 haxis=axis1 vaxis=axis2;
run;
quit;
data con6;
 set concy;
 x=peop81/peop80;
 yhat6=9.802+.916*(log(x));
 yhatf=yhat6**(1/.3);
run;
proc sort data=con6;
 by yhatf;
run;
symbol1 color=black interpol=join;
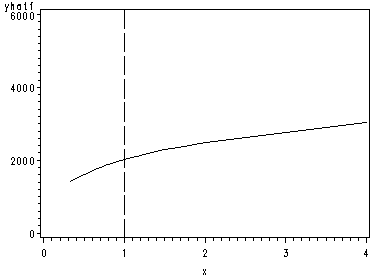
axis1 order=(0 to 4 by 1);
axis2 order=(0 to 6000 by 2000);
proc gplot data=con6;
 plot yhatf*x / href=1 lhref=22 haxis=axis1 vaxis=axis2;
run;
quit;
Estimating Nonlinear Models
page 168 Table 5.3 Percentage of women with at least one child, by women’s age and year of birth (England and Wales), using the child data set.
proc print data=child noobs;
 where age in (15 20 25 30 35 40 45);
 var age c1920 c1930 c1940 c1945 c1950 c1955 c1960;
run;
age c1920 c1930 c1940 c1945 c1950 c1955 c196015 0 0 0 0 0 0 0 20 7 9 13 17 19 18 13 25 39 48 59 60 53 45 39 25 . . . . . . . 30 67 75 82 82 75 68 . 35 76 83 87 88 83 . . 40 78 86 89 90 . . . 45 . 86 89 . . . .
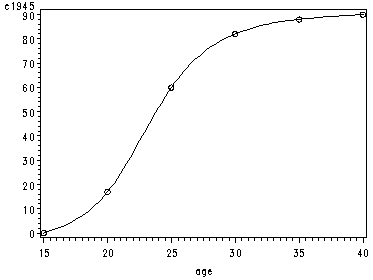
page 169 Figure 5.19 Gompertz curve fit to 1945 cohort data from Table 5.3.
symbol2 color=black interpol=spline v=circle;
axis1 order=(15 to 40 by 5);
axis2 order=(0 to 90 by 10);
proc gplot data=child;
 plot c1945*age / haxis=axis1 vaxis=axis2;
run;
quit;
Figure 5.19
page 170 Table 5.5 Results from nonlinear regression fitting Gompertz curve to 1945 cohort data (Tables 5.3 and 5.4).
proc nlin data=child trace;
 model c1945=alpha*exp(-gamma*exp(-beta*age));
 parms alpha=89 gamma=942 beta=.31;
run;
The NLIN Procedure— Program Execution Starting. 1 1 (3281:2) Executing Stmt : MODEL MODEL.c1945 = 1 (3281:24) #temp1 = – (gamma=942) = -942 1 (3281:35) #temp2 = – (beta=0.31) = -0.31 1 (3281:40) #temp3 = (#temp2=-0.31) * (age=10) = -3.1 1 (3281:34) #temp4 = EXP( #temp3=-3.1 ) = 0.0450492024 1 (3281:30) #temp5 = (#temp1=-942) * (#temp4=0.0450492024) = -42.43634865 1 (3281:23) #temp6 = EXP( #temp5=-42.43634865 ) = 3.716447E-19 1 (3281:19) MODEL.c1945 = (alpha=89) * (#temp6=3.716447E-19) = 3.307638E-17 1 (3281:40) _DER_ = eeocf( _DER_=1 ) = 1 1 (3281:40) @1dt1_1 = (-1) * (age=10) = -10 1 (3281:34) @1dt1_2 = (@1dt1_1=-10) * (#temp4=0.0450492024) = -0.450492024 1 (3281:30) @1dt1_3 = (-1) * (#temp4=0.0450492024) = -0.045049202 1 (3281:30) @1dt1_4 = (#temp1=-942) * (@1dt1_2=-0.450492024) = 424.36348655 1 (3281:23) @1dt1_5 = (@1dt1_3=-0.045049202) * (#temp6=3.716447E-19) = -1.67423E-20 1 (3281:23) @1dt1_6 = (@1dt1_4=424.36348655) * (#temp6=3.716447E-19) = 1.577124E-16 1 (3281:19) @MODEL.c1945/@alpha = #temp6 = 3.716447E-19 1 (3281:19) @MODEL.c1945/@gamma = (alpha=89) * (@1dt1_5=-1.67423E-20) = -1.49006E-18 1 (3281:19) @MODEL.c1945/@beta = (alpha=89) * (@1dt1_6=1.577124E-16) = 1.403641E-14 — Program Execution Finished. <iterations continue…>
The NLIN Procedure Iterative Phase Dependent Variable c1945 Method: Gauss-Newton
— Program Execution Starting. 37 1 (3281:2) Executing Stmt : MODEL MODEL.c1945 = 37 (3281:24) #temp1 = – (gamma=468.05746211) = -468.0574621 37 (3281:35) #temp2 = – (beta=0.2817027427) = -0.281702743 37 (3281:40) #temp3 = (#temp2=-0.281702743) * (age=45) = -12.67662342 37 (3281:34) #temp4 = EXP( #temp3=-12.67662342 ) = 3.1232906E-6 37 (3281:30) #temp5 = (#temp1=-468.0574621) * (#temp4=3.1232906E-6) = -0.001461879 37 (3281:23) #temp6 = EXP( #temp5=-0.001461879 ) = 0.9985391885 37 (3281:19) MODEL.c1945 = (alpha=90.425341758) * (#temp6=0.9985391885) = 90.293247383 37 (3281:40) _DER_ = eeocf( _DER_=1 ) = 1 37 (3281:40) @1dt1_1 = (-1) * (age=45) = -45 37 (3281:34) @1dt1_2 = (@1dt1_1=-45) * (#temp4=3.1232906E-6) = -0.000140548 37 (3281:30) @1dt1_3 = (-1) * (#temp4=3.1232906E-6) = -3.123291E-6 37 (3281:30) @1dt1_4 = (#temp1=-468.0574621) * (@1dt1_2=-0.000140548) = 0.0657845768 37 (3281:23) @1dt1_5 = (@1dt1_3=-3.123291E-6) * (#temp6=0.9985391885) = -3.118728E-6 37 (3281:23) @1dt1_6 = (@1dt1_4=0.0657845768) * (#temp6=0.9985391885) = 0.065688478 37 (3281:19) @MODEL.c1945/@alpha = #temp6 = 0.9985391885 37 (3281:19) @MODEL.c1945/@gamma = (alpha=90.425341758) * (@1dt1_5=-3.118728E-6) = -0.000282012 37 (3281:19) @MODEL.c1945/@beta = (alpha=90.425341758) * (@1dt1_6=0.065688478) = 5.9399030693 — Program Execution Finished.
Estimation Summary
Method Gauss-Newton Iterations 5 Subiterations 1 Average Subiterations 0.2 R 4.664E-7 PPC(gamma) 3.744E-8 RPC(beta) 1.308E-6 Object 8.899E-7 Objective 0.118423 Observations Read 37 Observations Used 6 Observations Missing 31
NOTE: An intercept was not specified for this model.
The NLIN Procedure
Sum of Mean Approx Source DF Squares Square F Value Pr > F
Regression 3 26456.9 8819.0 223411 <.0001 Residual 3 0.1184 0.0395 Uncorrected Total 6 26457.0
Corrected Total 5 7528.8
Approx Parameter Estimate Std Error Approximate 95% Confidence Limits
alpha 90.4253 0.1607 89.9140 90.9367 gamma 468.1 22.5464 396.3 539.8 beta 0.2817 0.00222 0.2746 0.2888
Approximate Correlation Matrix alpha gamma beta
alpha 1.0000000 -0.5869130 -0.6341724 gamma -0.5869130 1.0000000 0.9927144 beta -0.6341724 0.9927144 1.0000000
Interpretation
page 172 Table 5.6 Gompertz parameter estimates for fertility data (Table 5.3).
proc nlin data=child;
 model c1920=alpha*exp(-gamma*exp(-beta*age));
 parms alpha=89 gamma=942 beta=.31;
run;
The NLIN Procedure Iterative Phase Dependent Variable c1920 Method: Gauss-NewtonSum of Iter alpha gamma beta Squares
0 89.0000 942.0 0.3100 908.7 1 84.1937 344.9 0.2734 688.2 2 80.7767 114.6 0.2217 358.4 3 81.2881 170.8 0.2218 26.3825 4 80.4713 243.9 0.2383 25.9191 5 80.0036 347.4 0.2522 14.7825 6 79.8819 417.4 0.2568 3.4144 7 79.7845 453.8 0.2595 2.7514 8 79.7730 460.1 0.2599 2.7276 9 79.7706 461.0 0.2600 2.7275 10 79.7706 461.1 0.2600 2.7275 11 79.7706 461.1 0.2600 2.7275
NOTE: Convergence criterion met.
Estimation Summary
Method Gauss-Newton Iterations 11 Subiterations 2 Average Subiterations 0.181818 R 8.266E-7 PPC(gamma) 2.145E-7 RPC(gamma) 6.055E-6 Object 2.73E-10 Objective 2.727541 Observations Read 37 Observations Used 6 Observations Missing 31
NOTE: An intercept was not specified for this model.
Sum of Mean Approx Source DF Squares Square F Value Pr > F
Regression 3 17916.3 5972.1 6568.65 <.0001 Residual 3 2.7275 0.9092 Uncorrected Total 6 17919.0
Corrected Total 5 6037.5
The NLIN Procedure
Approx Parameter Estimate Std Error Approximate 95% Confidence Limits
alpha 79.7706 0.9120 76.8683 82.6729 gamma 461.1 129.7 48.2009 874.0 beta 0.2600 0.0119 0.2220 0.2980
Approximate Correlation Matrix alpha gamma beta
alpha 1.0000000 -0.6347219 -0.6831040 gamma -0.6347219 1.0000000 0.9933540 beta -0.6831040 0.9933540 1.0000000
proc nlin data=child;
 model c1930=alpha*exp(-gamma*exp(-beta*age));
 parms alpha=89 gamma=942 beta=.31;
run;
The NLIN Procedure Iterative Phase Dependent Variable c1930 Method: Gauss-NewtonSum of Iter alpha gamma beta Squares
0 89.0000 942.0 0.3100 224.5 1 87.6722 557.2 0.2858 122.3 2 86.6579 435.7 0.2662 4.4281 3 86.5213 520.6 0.2725 1.0352 4 86.5128 536.3 0.2730 0.5993 5 86.5105 537.9 0.2731 0.5988 6 86.5105 537.9 0.2731 0.5988
NOTE: Convergence criterion met.
Estimation Summary
Method Gauss-Newton Iterations 6 Subiterations 1 Average Subiterations 0.166667 R 4.813E-6 PPC(gamma) 6.939E-7 RPC(gamma) 0.000042 Object 2.306E-7 Objective 0.598817 Observations Read 37 Observations Used 7 Observations Missing 30
NOTE: An intercept was not specified for this model.
Sum of Mean Approx Source DF Squares Square F Value Pr > F
Regression 3 29690.4 9896.8 66109.0 <.0001 Residual 4 0.5988 0.1497 Uncorrected Total 7 29691.0
Corrected Total 6 8295.4
The NLIN Procedure
Approx Parameter Estimate Std Error Approximate 95% Confidence Limits
alpha 86.5105 0.2601 85.7884 87.2325 gamma 537.9 51.2574 395.6 680.2 beta 0.2731 0.00408 0.2618 0.2844
Approximate Correlation Matrix alpha gamma beta
alpha 1.0000000 -0.5118608 -0.5603048 gamma -0.5118608 1.0000000 0.9923590 beta -0.5603048 0.9923590 1.0000000
proc nlin data=child;
 model c1940=alpha*exp(-gamma*exp(-beta*age));
 parms alpha=89 gamma=942 beta=.31;
run;
The NLIN Procedure Iterative Phase Dependent Variable c1940 Method: Gauss-NewtonSum of Iter alpha gamma beta Squares
0 89.0000 942.0 0.3100 0.5174 1 89.1041 941.5 0.3095 0.4121 2 89.1039 942.0 0.3096 0.4121 3 89.1039 942.0 0.3096 0.4121
NOTE: Convergence criterion met.
Estimation Summary
Method Gauss-Newton Iterations 3 R 5.793E-8 PPC 9.116E-9 RPC(gamma) 1.122E-6 Object 2.95E-10 Objective 0.412135 Observations Read 37 Observations Used 7 Observations Missing 30
NOTE: An intercept was not specified for this model.
Sum of Mean Approx Source DF Squares Square F Value Pr > F
Regression 3 33784.6 11261.5 109299 <.0001 Residual 4 0.4121 0.1030 Uncorrected Total 7 33785.0
Corrected Total 6 8704.9
Approx Parameter Estimate Std Error Approximate 95% Confidence Limits
alpha 89.1039 0.1958 88.5603 89.6475 gamma 942.0 75.3532 732.8 1151.2 beta 0.3096 0.00359 0.2996 0.3195
The NLIN Procedure
Approximate Correlation Matrix alpha gamma beta
alpha 1.0000000 -0.4638613 -0.5082185 gamma -0.4638613 1.0000000 0.9925031 beta -0.5082185 0.9925031 1.0000000
proc nlin data=child;
 model c1945=alpha*exp(-gamma*exp(-beta*age));
 parms alpha=89 gamma=942 beta=.31;
run;
The NLIN Procedure Iterative Phase Dependent Variable c1945 Method: Gauss-NewtonSum of Iter alpha gamma beta Squares
0 89.0000 942.0 0.3100 17.5420 1 89.6936 589.8 0.2949 4.9287 2 90.3606 450.9 0.2816 1.8121 3 90.4275 466.2 0.2816 0.1194 4 90.4253 468.1 0.2817 0.1184 5 90.4253 468.1 0.2817 0.1184
NOTE: Convergence criterion met.
Estimation Summary
Method Gauss-Newton Iterations 5 Subiterations 1 Average Subiterations 0.2 R 4.664E-7 PPC(gamma) 3.744E-8 RPC(beta) 1.308E-6 Object 8.899E-7 Objective 0.118423 Observations Read 37 Observations Used 6 Observations Missing 31
NOTE: An intercept was not specified for this model.
Sum of Mean Approx Source DF Squares Square F Value Pr > F
Regression 3 26456.9 8819.0 223411 <.0001 Residual 3 0.1184 0.0395 Uncorrected Total 6 26457.0
Corrected Total 5 7528.8
The NLIN Procedure
Approx Parameter Estimate Std Error Approximate 95% Confidence Limits
alpha 90.4253 0.1607 89.9140 90.9367 gamma 468.1 22.5464 396.3 539.8 beta 0.2817 0.00222 0.2746 0.2888
Approximate Correlation Matrix alpha gamma beta
alpha 1.0000000 -0.5869130 -0.6341724 gamma -0.5869130 1.0000000 0.9927144 beta -0.6341724 0.9927144 1.0000000
proc nlin data=child;
 model c1950=alpha*exp(-gamma*exp(-beta*age));
 parms alpha=89 gamma=942 beta=.31;
run;
The NLIN Procedure Iterative Phase Dependent Variable c1950 Method: Gauss-NewtonSum of Iter alpha gamma beta Squares
0 89.0000 942.0 0.3100 137.6 1 88.3339 476.1 0.2884 136.1 2 87.7532 278.7 0.2673 130.8 3 87.4487 199.1 0.2506 82.0930 4 87.2675 132.7 0.2281 19.0549 5 87.4975 142.5 0.2266 0.8777 6 87.5084 145.1 0.2272 0.8550 7 87.5148 144.9 0.2271 0.8549 8 87.5145 144.9 0.2272 0.8549 9 87.5145 144.9 0.2272 0.8549
NOTE: Convergence criterion met.
Estimation Summary
Method Gauss-Newton Iterations 9 Subiterations 4 Average Subiterations 0.444444 R 1.323E-6 PPC(gamma) 3.096E-7 RPC(gamma) 4.722E-6 Object 3.79E-10 Objective 0.854935 Observations Read 37 Observations Used 5 Observations Missing 32
NOTE: An intercept was not specified for this model.
Sum of Mean Approx Source DF Squares Square F Value Pr > F
Regression 3 15683.1 5227.7 12229.5 <.0001 Residual 2 0.8549 0.4275 Uncorrected Total 5 15684.0
Corrected Total 4 5104.0
The NLIN Procedure
Approx Parameter Estimate Std Error Approximate 95% Confidence Limits
alpha 87.5145 1.0212 83.1208 91.9082 gamma 144.9 24.2770 40.4323 249.3 beta 0.2272 0.00801 0.1927 0.2616
Approximate Correlation Matrix alpha gamma beta
alpha 1.0000000 -0.7741598 -0.8223874 gamma -0.7741598 1.0000000 0.9927427 beta -0.8223874 0.9927427 1.0000000
proc nlin data=child;
 model c1955=alpha*exp(-gamma*exp(-beta*age));
 parms alpha=89 gamma=942 beta=.31;
run;
The NLIN Procedure Iterative Phase Dependent Variable c1955 Method: Gauss-NewtonSum of Iter alpha gamma beta Squares
0 89.0000 942.0 0.3100 414.9 1 88.1357 614.8 0.2941 369.0 2 87.5279 450.1 0.2813 322.6 3 87.1016 348.8 0.2703 280.8 4 86.5150 213.2 0.2510 261.5 5 86.0279 124.2 0.2287 240.9 6 85.3124 57.2525 0.1945 200.8 7 86.8273 56.1596 0.1786 5.4893 8 88.4678 62.0523 0.1818 3.5418 9 88.9640 60.1061 0.1800 3.4901 10 88.9317 60.3631 0.1801 3.4894 11 88.9496 60.2852 0.1801 3.4894 12 88.9462 60.3008 0.1801 3.4894 13 88.9470 60.2974 0.1801 3.4894 14 88.9468 60.2981 0.1801 3.4894
NOTE: Convergence criterion met.
Estimation Summary
Method Gauss-Newton Iterations 14 Subiterations 9 Average Subiterations 0.642857 R 4.166E-6 PPC(gamma) 2.484E-6 RPC(gamma) 0.000012 Object 3.06E-10 Objective 3.489423 Observations Read 37 Observations Used 4 Observations Missing 33
NOTE: An intercept was not specified for this model.
The NLIN Procedure
Sum of Mean Approx Source DF Squares Square F Value Pr > F
Regression 3 6969.5 2323.2 665.77 0.0285 Residual 1 3.4894 3.4894 Uncorrected Total 4 6973.0
Corrected Total 3 2682.8
Approx Parameter Estimate Std Error Approximate 95% Confidence Limits
alpha 88.9468 10.4932 -44.3793 222.3 gamma 60.2981 37.9150 -421.5 542.0 beta 0.1801 0.0333 -0.2433 0.6035
Approximate Correlation Matrix alpha gamma beta
alpha 1.0000000 -0.9078475 -0.9441516 gamma -0.9078475 1.0000000 0.9936525 beta -0.9441516 0.9936525 1.0000000
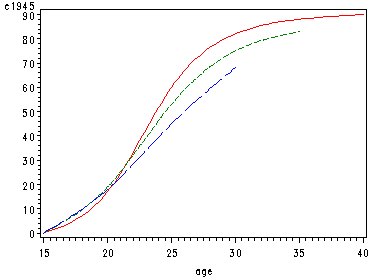
page 172 Figure 5.20 Gompertz curves for 1945, 1950 and 1955 cohort data (see Table 5.6).
symbol1 color=red interpol=spline line=1;*1945;
symbol2 color=green interpol=spline line=3;*1950;
symbol3 color=blue interpol=spline line=22;*1955;
axis1 order=(15 to 40 by 5);
axis2 order=(0 to 90 by 10);
proc gplot data=child;
 plot c1945*age=1 c1950*age=2 c1955*age=3 / overlay haxis=axis1 vaxis=axis2;
run;
quit;
Figure 5.20

