Section 5.2
Estimating the Survival Function for Left, Double, and Interval Censoring
Example 5.1 illustrating Turnbull’s algorithm. We therefore create Table 5.1, Table 5.2 and Table 5.3 all through data steps and proc sql to show the steps.
data table5_1;
 input age num_lcen num_event num_rcen;
cards;
0  0  0  0
10 0  4  0
11 0 12  0
12 0 19  2
13 1 24 15
14 2 20 24
15 3 13 18
16 2  3 14
17 3  1  6
18 1  0  0
19 0  4  0
;
run;
proc sql noprint;
  select sum(num_event)+ sum(num_rcen) into :total
  from table5_1;
quit;
data table5_1a;
 set table5_1;
 id = _n_;
 elag = lag(num_event);
 rlag = lag(num_rcen);
 retain y &total survival 1;
 if _n_ >= 2 then  y = y - rlag - elag;
 survival = survival*(1-num_event/y);
 drop elag rlag;
run;
proc print data=table5_1a noobs;
var id num_lcen num_event num_rcen y survival;
run;
                  num_
id    num_lcen    event    num_rcen      y    survival

 1        0          0         0       179     1.00000
 2        0          4         0       179     0.97765
 3        0         12         0       175     0.91061
 4        0         19         2       163     0.80447
 5        1         24        15       142     0.66850
 6        2         20        24       103     0.53870
 7        3         13        18        59     0.42000
 8        2          3        14        28     0.37500
 9        3          1         6        11     0.34091
10        1          0         0         4     0.34091
11        0          4         0         4     0.0000
Table 5.2, step 1 of Turnbull’s algorithm.
data table5_2;
 set table5_1a;
 keep survival;
run;

proc sort data = table5_2;
 by descending survival  ;
run;

proc transpose data=table5_2 out=long52 (drop = _name_);
   var survival;
run;

proc sql;
 create table table5_2b as
 select *
 from table5_1a , long52;
quit;
data table5_2c;
 set table5_2b nobs=last;
 slag = lag(survival);
 array s(11) col1-col11;
 array p(11);
   do i = 2 to 10;
    p(i) = (slag - survival)/(1 - s(i+1));
 end;
 if _n_ = last then
   do i = 2 to 10;
    p(i) = 0;
      end;
run;

proc print data = table5_2c ;
  var p4-p9;
  where p2 ne . ;
run;
Obs       p4         p5         p6         p7         p8         p9

  2    0.06741    0.04844    0.03853    0.03575    0.03390    0.03390
  3    0.20223    0.14533    0.11558    0.10726    0.10171    0.10171
  4    0.32020    0.23010    0.18301    0.16983    0.16105    0.16105
  5    0.41016    0.29474    0.23443    0.21755    0.20629    0.20629
  6    0.39158    0.28139    0.22380    0.20769    0.19695    0.19695
  7    0.35806    0.25731    0.20465    0.18991    0.18009    0.18009
  8    0.13575    0.09755    0.07759    0.07200    0.06828    0.06828
  9    0.10284    0.07390    0.05878    0.05455    0.05172    0.05172
 10    0.00000    0.00000    0.00000    0.00000    0.00000    0.00000
 11    0.00000    0.00000    0.00000    0.00000    0.00000    0.00000
Table 5.3, the first step of the Self-Consistency Algorithm.
data table5_3;
 set table5_2c;

  array p(6) p4-p9;
    if _n_ >=6  then
  	  do i = 1 to _n_ - 5;
    	  p(i) = 0;
	  end;
   if _n_ = 1 then dhat = 0;
   else dhat = num_event + p4 + 2*p5 + 3*p6 + 2*p7 + 3*p8 + p9;
 run;

 proc sql noprint;
  select sum(dhat) + sum(num_rcen) into :totaly
  from table5_3;
quit;

data table5_3a;
  set table5_3;

  dlag = lag(dhat);
  rlag = lag(num_rcen);
  retain yhat &totaly survival1 1;
  if _n_>=2 then  yhat = yhat - dlag - rlag;
  survival1 = survival1*abs((1-dhat/yhat));
run;

proc print data=table5_3a noobs;
 var id age dhat num_rcen  yhat survival1;
run;

id    age      dhat     num_rcen      yhat     survival1

 1      0     0.0000        0       191.000     1.00000
 2     10     4.4870        0       191.000     0.97651
 3     11    13.4610        0       186.513     0.90603
 4     12    21.3133        2       173.052     0.79444
 5     13    26.9632       15       149.739     0.65139
 6     14    22.4374       24       107.775     0.51578
 7     15    14.7141       18        61.338     0.39205
 8     16     3.4171       14        28.624     0.34525
 9     17     1.2069        6        11.207     0.30807
10     18     0.0000        0         4.000     0.30807
11     19     4.0000        0         4.000     0.00000
Example 5.2 on estimation procedure for interval-censored data. It uses the data described in section 1.18. SAS currently doesn’t have a standard procedure on nonparametric survival analysis for interval-censored data. But it has a macro %ice that performs the analysis. Macro %ice makes use of a utility program called xmacro.sas. Program ice.sas is located at Both of the programs can be found from SAS. Here is a link to %ice and xmacro.sas. You need to download both programs for Example 5.2.
Section 5.3
Estimation of the Survival Function for Right-Truncated Data
This section uses the data set described in section 1.19. We created a SAS data step for it.
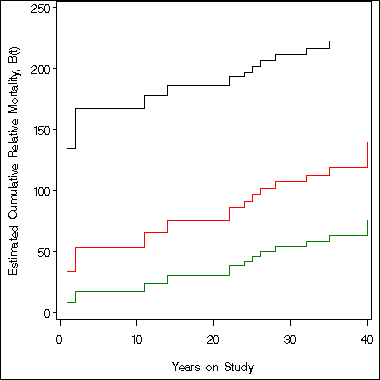
Example 6.3, Table 6.3 and Figure 6.8. The first part of the program creates the hazard rate based on the Iowa life table. The macro does the computation for table 6.3 including the confidence intervals. We notice that the output produced below does not match with Table 6.3 completely. The data for table 6.3 is then used for Figure 6.8.
proc sort data = iowa_60_mortality;
  by male;
run;
data table6_2;
  set iowa_60_mortality;
  by male;
  ls = lag(survival);
  if ~first.male then do;
  hr = log(ls) - log(survival); end;
  drop survival;
  if hr ~=.;
run;

%macro rel_mortality(data, age, time, death, outdata);

proc sql noprint;
  select count( distinct &time)  into :max_num
  from &data
  where &death = 1;
quit;

proc sql noprint;
  select count(&time) into :dpoint separated by ' '
  from &data
  where &death = 1
  group by &time;
quit;

proc sql noprint;
  select distinct &time into :tpoint separated by ' '
  from &data
  where &death = 1;
quit;

  %do  k = 1 %to &max_num;
     %let p = %scan(&tpoint, &k);
        proc sql noprint;
          select sum(y.hr) into :q&k
          from &data as x, table6_2 as y
          where 1-x.female = y.male and x.age + &p + 1 = y.age and x.time >= &p ;
	  quit;
  %end;

  data &outdata;
    b = 0;
	v = 0;
    %do i = 1 %to &max_num;
    t = %scan(&tpoint, &i);
	d = %scan(&dpoint, &i);
    q = &&q&i;
	b = b + d/q;
	v = v + d/q**2;
	s = sqrt(v);
	lc = b/exp(1.96*s/b);/*log-transformed confidence interval*/
	uc = b*exp(1.96*s/b);
    output;
    %end;
  run;

  proc print data= &outdata noobs;
  var t d q b v s lc uc;
  run;
%mend rel_mortality;

%rel_mortality(sec1_15, age, time, death, temp)

 t    d       q          b          v          s          lc         uc

 1    2    0.05932     33.718     568.44    23.8420     8.4325    134.822
 2    1    0.04964     53.861     974.20    31.2122    17.2982    167.707
11    1    0.08524     65.593    1111.84    33.3443    24.2183    177.654
14    1    0.10278     75.323    1206.51    34.7349    30.5066    185.979
22    2    0.18238     86.289    1266.64    35.5899    38.4478    193.660
24    1    0.21559     90.928    1288.15    35.8909    41.9472    197.100
25    1    0.17002     96.809    1322.75    36.3696    46.3583    202.164
26    1    0.19441    101.953    1349.20    36.7315    50.3179    206.574
28    1    0.18434    107.377    1378.63    37.1299    54.5220    211.473
32    1    0.18562    112.765    1407.66    37.5187    58.7436    216.465
35    1    0.16755    118.733    1443.28    37.9905    63.4180    222.296
40    1    0.04902    139.135    1859.50    43.1219    75.7912    255.419
symbol i = stepjl;
axis1 order = (0 to 250 by 50) label=(a=90 'Estimated Cumulative Relative Mortality, B(t)')
      minor = none;
axis2 order = (0 to 40 by 10) minor = none label=('Years on Study');
proc gplot data= temp;
plot uc*t b*t lc*t/overlay vaxis = axis1 haxis = axis2;
run;
quit;

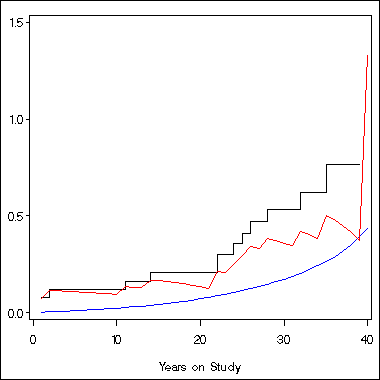
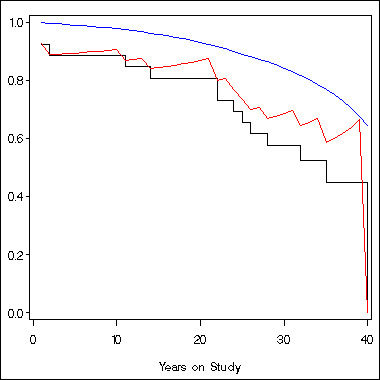
Example 6.3 continued on page 169. Table 6.4, Figure 6.9 and Figure 6.10. The proc sql step and data steps below prepares us to create Table 6.4. The macro program generates Table 6.4.
proc sql;
  create table table6_4 as
  select time, sum(death) as d, sum(death=0) as censor
  from sec1_15
  group by time;
quit;

data table6_4a;
  do time = 1 to 40;
  output; end;
run;
data table6_4b;
  merge table6_4 table6_4a ;
  by time;
  if d = . then d = 0;
  if censor = . then censor = 0;
  retain y 26;
  ld = lag(d);
  lc = lag(censor);
  if _n_>1 then y = y-ld - lc;
  drop ld lc;
run;

%macro theta(data, time, max, outdata);
  %do  k = 1 %to &max;
      proc sql noprint;
      select sum(y.hr) into :q&k
        from &data as x, table6_2 as y
        where 1-x.female = y.male and x.age + &k = y.age and x.time > &k - 1  ;
	  quit;
  %end;
  data &outdata;
    set table6_4b;
    retain theta 0;
	retain p var_a 0;
	retain h 0;
	retain s1 1;
	q = symget('q'||left(_n_));
	theta = theta + q/y;
	p = p + d/y;
	h = h + d/y;
	s1 = s1*(1-d/y);
	var_a = var_a + d/y**2;
	a = p - theta;
	sda = sqrt(var_a);
	survival = exp(-theta);
	sc = s1/survival;
	drop q p censor;
   run;
	proc print data = temp noobs;
	var time d y h theta a sda s1 survival sc;
	run;
%mend;
%theta(sec1_15, time, 40, temp)

time    d     y       h        theta        a         sda         s1      survival       sc

  1     2    26    0.07692    0.00213    0.07479    0.05439    0.92308     0.99787    0.92505
  2     1    24    0.11859    0.00406    0.11453    0.06852    0.88462     0.99595    0.88822
  3     0    23    0.11859    0.00594    0.11265    0.06852    0.88462     0.99408    0.88988
  4     0    23    0.11859    0.00794    0.11065    0.06852    0.88462     0.99209    0.89167
  5     0    23    0.11859    0.01008    0.10851    0.06852    0.88462     0.98997    0.89358
  6     0    23    0.11859    0.01237    0.10622    0.06852    0.88462     0.98771    0.89563
  7     0    23    0.11859    0.01483    0.10376    0.06852    0.88462     0.98528    0.89783
  8     0    23    0.11859    0.01747    0.10112    0.06852    0.88462     0.98269    0.90020
  9     0    23    0.11859    0.02032    0.09827    0.06852    0.88462     0.97989    0.90277
 10     0    23    0.11859    0.02341    0.09518    0.06852    0.88462     0.97686    0.90557
 11     1    23    0.16207    0.02679    0.13528    0.08115    0.84615     0.97357    0.86913
 12     0    22    0.16207    0.03029    0.13178    0.08115    0.84615     0.97016    0.87218
 13     0    22    0.16207    0.03414    0.12793    0.08115    0.84615     0.96643    0.87554
 14     1    22    0.20752    0.03838    0.16914    0.09301    0.80769     0.96235    0.83929
 15     0    21    0.20752    0.04279    0.16473    0.09301    0.80769     0.95811    0.84300
 16     0    21    0.20752    0.04811    0.15941    0.09301    0.80769     0.95303    0.84750
 17     0    21    0.20752    0.05297    0.15455    0.09301    0.80769     0.94841    0.85163
 18     0    21    0.20752    0.05882    0.14871    0.09301    0.80769     0.94288    0.85662
 19     0    21    0.20752    0.06522    0.14230    0.09301    0.80769     0.93686    0.86213
 20     0    21    0.20752    0.07222    0.13530    0.09301    0.80769     0.93032    0.86818
 21     0    21    0.20752    0.08035    0.12717    0.09301    0.80769     0.92280    0.87527
 22     2    21    0.30276    0.08872    0.21405    0.11483    0.73077     0.91511    0.79856
 23     0    19    0.30276    0.09674    0.20603    0.11483    0.73077     0.90780    0.80499
 24     1    19    0.35539    0.10611    0.24928    0.12632    0.69231     0.89932    0.76981
 25     1    18    0.41095    0.11683    0.29411    0.13800    0.65385     0.88973    0.73488
 26     1    17    0.46977    0.12554    0.34423    0.15001    0.61538     0.88202    0.69770
 27     0    16    0.46977    0.13628    0.33349    0.15001    0.61538     0.87260    0.70524
 28     1    16    0.53227    0.14737    0.38490    0.16251    0.57692     0.86297    0.66853
 29     0    15    0.53227    0.15924    0.37303    0.16251    0.57692     0.85279    0.67651
 30     0    15    0.53227    0.17294    0.35933    0.16251    0.57692     0.84119    0.68584
 31     0    13    0.53227    0.18722    0.34505    0.16251    0.57692     0.82926    0.69571
 32     1    11    0.62318    0.20356    0.41962    0.18621    0.52448     0.81582    0.64288
 33     0    10    0.62318    0.22147    0.40171    0.18621    0.52448     0.80134    0.65450
 34     0     8    0.62318    0.24193    0.38125    0.18621    0.52448     0.78511    0.66803
 35     1     7    0.76604    0.26380    0.50223    0.23470    0.44955     0.76812    0.58526
 36     0     4    0.76604    0.28556    0.48048    0.23470    0.44955     0.75160    0.59813
 37     0     3    0.76604    0.31402    0.45202    0.23470    0.44955     0.73051    0.61540
 38     0     2    0.76604    0.35176    0.41428    0.23470    0.44955     0.70345    0.63907
 39     0     2    0.76604    0.39333    0.37271    0.23470    0.44955     0.67481    0.66619
 40     1     1    1.76604    0.43709    1.32895    1.02717    0.00000     0.64591    0.00000


axis1 order = (0 to 1.5 by .5) label=(' ') minor = none;
axis2 order = (0 to 40 by 10) label=('Years on Study') minor = none;
symbol1 i = stepjl c = black;
symbol2 i = join c = blue;
symbol3 i = join c = red;
proc gplot data = temp;
  plot h*time = 1 theta*time = 2 a*time = 3 /overlay vaxis = axis1 haxis=axis2;
run;
quit;

axis1 order = (0 to 1 by .2) label=(' ') minor = none;
axis2 order = (0 to 40 by 10) label=('Years on Study') minor = none;
symbol1 i = stepjl c = black;
symbol2 i = join c = blue;
symbol3 i = join c = red;
proc gplot data = temp;
  plot s1*time = 1 survival*time = 2 sc*time = 3 /overlay vaxis = axis1
haxis=axis2;
run;
quit;
Section 6.4 Bayesian Nonparametric Methods
Under construction.

