Section 12.2: Weibull Distribution
A data step creates a data set called sec1_9 and it can be downloaded here. We will use this data set in Example 12. 1 on page 377 for allo group. The analysis for auto group will be almost identical with the only change on the where statement. We omit the second analysis here.
proc lifereg data = sec1_9;
  model time*ind(0)= /covb distribution=weibull;
  where type = 1;
  ods output ParameterEstimates = test;
  ods output covB = covB;
run;
data test;
  set test;
  if parameter ~= "cons" & parameter ~= "Weibull Shape";
run;
proc iml;
  use covB;
  read all var {Intercept Scale};
  x = Intercept || Scale ;

  start grd(g); /*creating the gradient matrix corresponding to the transform*/

	  grdn = j(2, 2, 0);
	  grdn[1,1] = - exp(-g[1]/g[2])/g[2];
	  grdn[1,2] = (exp(-g[1]/g[2])*g[1])/(g[2]**2);
	  grdn[2,2] = -1/(g[2]**2);
  return (grdn) ;
  finish grd;

  use test;
  read all var {parameter estimate};
  est = estimate;
  parms = parameter;

  mytet = grd(est);
  print "Variance-Covariance Matrix";
  covb= mytet*x*t(mytet);
  print covb;
  newvar = sqrt(diag(mytet*x*t(mytet))); /*delta method to calculate the variance*/

  gnew = j(2, 1, 0);
  gstd = j(2, 1, 0);

  do i = 1 to 2; /*pulling out the standard error*/
     gstd[i]=newvar[i,i];
	   end;

  gnew[1] = exp(-est[1]/est[2]); /*doing the transformation*/
  gnew[2] = 1/est[2];

  print "Transformed Parameter Estimate";
  print gnew[rowname = parms colname = "Parameter Estimate" label=" " format=8.3]
        gstd[colname = "  Standard Error" label = " " format=8.3];
quit;
The LIFEREG Procedure

           Model Information

Data Set                     WORK.SEC1_9
Dependent Variable             Log(time)
Censoring Variable                   ind
Censoring Value(s)                     0
Number of Observations                50
Noncensored Values                    22
Right Censored Values                 28
Left Censored Values                   0
Interval Censored Values               0
Name of Distribution             Weibull
Log Likelihood               -72.8790866


                    Analysis of Parameter Estimates

                          Standard   95% Confidence     Chi-
Parameter     DF Estimate    Error       Limits       Square Pr > ChiSq

Intercept      1   4.2543   0.4782   3.3171   5.1915   79.16     <.0001
Scale          1   1.9444   0.3679   1.3420   2.8173
Weibull Scale  1  70.4075  33.6656  27.5813 179.7314
Weibull Shape  1   0.5143   0.0973   0.3549   0.7452

     Estimated Covariance Matrix

              Intercept         Scale

Intercept      0.228631      0.087660
Scale          0.087660      0.135335

From Proc IML

Variance-Covariance Matrix

        COVB

0.0016396  -0.00318
 -0.00318 0.0094681

Transformed Parameter Estimate

              Parameter Estimate   Standard Error

Intercept                  0.112            0.040
Scale                      0.514            0.097
Example 12. 2, Table 12.1 and Table 12.2 on page 379 and page 380. This example uses a data set described in section 1.8. We create the data set here and call it larynx.
data table12_1;
  set larynx_cancer;
  z1 = (stage = 2);
  z2 = (stage = 3);
  z3 = (stage = 4);
run;
proc lifereg data = table12_1;
  model time*death(0)= z1 z2 z3 age / covb distribution=weibull;
  ods output ParameterEstimates = test;
  ods output covB = covB;
run;
The LIFEREG Procedure

                    Analysis of Parameter Estimates

                          Standard   95% Confidence     Chi-
Parameter     DF Estimate    Error       Limits       Square Pr > ChiSq

Intercept      1   3.5288   0.9041   1.7567   5.3008   15.23     <.0001
z1             1  -0.1477   0.4076  -0.9465   0.6511    0.13     0.7171
z2             1  -0.5866   0.3199  -1.2136   0.0405    3.36     0.0668
z3             1  -1.5441   0.3633  -2.2561  -0.8321   18.07     <.0001
age            1  -0.0175   0.0128  -0.0425   0.0076    1.87     0.1717
Scale          1   0.8848   0.1084   0.6960   1.1250
Weibull Shape  1   1.1301   0.1384   0.8889   1.4368
Table 12.2 based on the previous output and delta method shown on page 378.
proc iml;
  use covB;
  read all var {Intercept z1 z2 z3 age Scale};
  x = Intercept || z1 || z2 || z3 || age || Scale ;

  start grd(g); /*creating the gradient matrix corresponding to the transform*/
      gdim = nrow(g);
	  grdn = j(gdim, gdim, 0);
	  grdn[1,1] = - exp(-g[1]/g[gdim])/g[gdim];
	  grdn[1,gdim] = (exp(-g[1]/g[gdim])*g[1])/(g[gdim]**2);

	  do i = 2 to gdim - 1;
	  grdn[i, gdim]=g[i]/(g[gdim]**2);
	  grdn[i,i] = - 1/g[gdim];
	  end;
	  grdn[gdim,gdim] = -1/(g[gdim]**2);

  return (grdn) ;
  finish grd;

  use test;
  read all var {parameter estimate};
  est = estimate;
  r = nrow(est);
  g = est[1:r-1, 1];
  parm = parameter;
  parms = parm[1:r-1,1];

  mytet = grd(g);
  newvar = sqrt(diag(mytet*x*t(mytet))); /*delta method to calculate the variance*/
  gnew = j(r-1, 1, 0);
  gstd = j(r-1, 1, 0);

  do i = 1 to r-1; /*pull out the standard error*/
     gstd[i]=newvar[i,i];
	   end;

  gnew[1] = exp(-g[1]/g[r-1]); /*doing the transformation*/
  gnew[r-1] = 1/g[r-1];
  do i = 2 to r-2;
    gnew[i] = - g[i]/g[r-1];
	  end;


  print "Transformed Parameter Estimate";
  print gnew[rowname = parms colname = "Parameter Estimate" label=" " format=8.3]
        gstd[colname = "  Standard Error" label = " " format=8.3];
quit;
Transformed Parameter Estimate

              Parameter Estimate   Standard Error

Intercept                  0.019            0.019
z1                         0.167            0.461
z2                         0.663            0.356
z3                         1.745            0.415
age                        0.020            0.014
Scale                      1.130            0.138
Section 12.3: Log Logistic Distribution
Example 12.1 (continued) on page 382. We will only do the analysis for allo group. The analysis for auto group will be nearly identical.
proc lifereg data = sec1_9;
  model time*ind(0)= /covb distribution=llogit;
  where type = 1;
  ods output ParameterEstimates = test;
  ods output covB = covB;
run;
data test;
  set test;
  if parameter ~= "cons";
run;
proc iml;
  use covB;
  read all var {Intercept Scale};
  x = Intercept || Scale ;

  start grd(g); /*creating the gradient matrix corresponding to the transform*/

	  grdn = j(2, 2, 0);
	  grdn[1,1] = - exp(-g[1]/g[2])/g[2];
	  grdn[1,2] = (exp(-g[1]/g[2])*g[1])/(g[2]**2);
	  grdn[2,2] = -1/(g[2]**2);
  return (grdn) ;
  finish grd;

  use test;
  read all var {parameter estimate};
  est = estimate;
  parms = parameter;

  mytet = grd(est);
  print "Variance-Covariance Matrix";
  covb= mytet*x*t(mytet);
  print covb;
  newvar = sqrt(diag(mytet*x*t(mytet))); /*delta method to calculate the variance*/

  gnew = j(2, 1, 0);
  gstd = j(2, 1, 0);

  do i = 1 to 2; /*pulling out the standard error*/
     gstd[i]=newvar[i,i];
	   end;

  gnew[1] = exp(-est[1]/est[2]); /*doing the transformation*/
  gnew[2] = 1/est[2];

  print "Transformed Parameter Estimate";
  print gnew[rowname = parms colname = "Parameter Estimate" label=" " format=8.3]
        gstd[colname = "  Standard Error" label = " " format=8.3];
quit;
The LIFEREG Procedure

           Model Information

Data Set                     WORK.SEC1_9
Dependent Variable             Log(time)
Censoring Variable                   ind
Censoring Value(s)                     0
Number of Observations                50
Noncensored Values                    22
Right Censored Values                 28
Left Censored Values                   0
Interval Censored Values               0
Name of Distribution           LLogistic
Log Likelihood              -71.72331008

                    Analysis of Parameter Estimates

                          Standard   95% Confidence     Chi-
Parameter     DF Estimate    Error       Limits       Square Pr > ChiSq

Intercept      1   3.4429   0.4760   2.5099   4.3759   52.31     <.0001
Scale          1   1.5839   0.2926   1.1029   2.2748

     Estimated Covariance Matrix

              Intercept         Scale

Intercept      0.226623      0.058140
Scale          0.058140      0.085586

Variance-Covariance Matrix

        COVB

0.0019512 -0.003661
-0.003661 0.0135976

Transformed Parameter Estimate

              Parameter Estimate   Standard Error

Intercept                  0.114            0.044
Scale                      0.631            0.117
Example 12. 2 (continued).
proc lifereg data = table12_1;
  model time*death(0)= z1 z2 z3 age / covb distribution=llogit;
  ods output ParameterEstimates = test;
  ods output covB = covB;
run;
proc iml;
  use covB;
  read all var {Intercept z1 z2 z3 age Scale};
  x = Intercept || z1 || z2 || z3 || age || Scale ;

  start grd(g); /*creating the gradient matrix corresponding to the transform*/
      gdim = nrow(g);
	  grdn = j(gdim, gdim, 0);
	  grdn[1,1] = - exp(-g[1]/g[gdim])/g[gdim];
	  grdn[1,gdim] = (exp(-g[1]/g[gdim])*g[1])/(g[gdim]**2);

	  do i = 2 to gdim - 1;
	  grdn[i, gdim]=g[i]/(g[gdim]**2);
	  grdn[i,i] = - 1/g[gdim];
	  end;
	  grdn[gdim,gdim] = -1/(g[gdim]**2);

  return (grdn) ;
  finish grd;

  use test;
  read all var {parameter estimate};
  est = estimate;
  parm = parameter;
  r = nrow(est);

  mytet = grd(est);
  newvar = sqrt(diag(mytet*x*t(mytet))); /*delta method to calculate the variance*/
  gnew = j(r, 1, 0);
  gstd = j(r, 1, 0);

  do i = 1 to r; /*pull out the standard error*/
     gstd[i]=newvar[i,i];
	   end;

  gnew[1] = exp(-est[1]/est[r]); /*doing the transformation*/
  gnew[r] = 1/est[r];
  do i = 2 to r-1;
    gnew[i] = - est[i]/est[r];
	  end;

  print "Transformed Parameter Estimate";
  print gnew[rowname = parm colname = "Parameter Estimate" label=" " format=8.3]
        gstd[colname = "  Standard Error" label = " " format=8.3];
quit;
The LIFEREG Procedure

            Model Information

Data Set                    WORK.TABLE12_1
Dependent Variable               Log(time)
Censoring Variable                   death
Censoring Value(s)                       0
Number of Observations                  90
Noncensored Values                      50
Right Censored Values                   40
Left Censored Values                     0
Interval Censored Values                 0
Name of Distribution             LLogistic
Log Likelihood                -108.1923738

       Type III Analysis of Effects

                         Wald
Effect       DF    Chi-Square    Pr > ChiSq

z1            1        0.0917        0.7621
z2            1        5.1844        0.0228
z3            1       17.2161        <.0001

The LIFEREG Procedure

       Type III Analysis of Effects

                         Wald
Effect       DF    Chi-Square    Pr > ChiSq

age           1        1.1995        0.2734

                    Analysis of Parameter Estimates

                          Standard   95% Confidence     Chi-
Parameter     DF Estimate    Error       Limits       Square Pr > ChiSq

Intercept      1   3.1022   0.9527   1.2350   4.9694   10.60     0.0011
z1             1  -0.1257   0.4152  -0.9395   0.6881    0.09     0.7621
z2             1  -0.8057   0.3539  -1.4993  -0.1122    5.18     0.0228
z3             1  -1.7661   0.4257  -2.6004  -0.9319   17.22     <.0001
age            1  -0.0151   0.0138  -0.0421   0.0119    1.20     0.2734
Scale          1   0.7152   0.0860   0.5651   0.9053

Transformed Parameter Estimate

              Parameter Estimate   Standard Error

Intercept                  0.013            0.018
z1                         0.176            0.581
z2                         1.127            0.498
z3                         2.469            0.632
age                        0.021            0.019
Scale                      1.398            0.168
Section 12.4: Other Parametric Models
Example 12.1 (continued), Table 12. 5 on page 387. We use the ODS feature of SAS 8 here to put all the output data sets from multiple procedures into one data set.
ods output ModelInfo (match_all=mymatch persist=proc) = table12_5;
proc lifereg data = sec1_9;
  model time*ind(0)= / distribution=exponential;
  by type;
run;
proc lifereg data = sec1_9;
  model time*ind(0)=/ distribution=weibull;
  by type;
run;
proc lifereg data = sec1_9;
  model time*ind(0)= / distribution=llogistic;
  by type;
run;
proc lifereg data = sec1_9;
  model time*ind(0)= / distribution=lnormal;
  by type;
run;
proc lifereg data = sec1_9;
  model time*ind(0)= / distribution=gamma;
  by type;
run;
ods output close;

data test (rename=(nvalue1=value));
set &mymatch;
if label1="Name of Distribution" or label1 = "Log Likelihood";
distribution = lag(cvalue1);
if nvalue1 ~= .;
drop label1 _proc_ _run_ cvalue1;
run;
data test2;
  set test;
  if distribution="Exponential"  then aic = -2*value + 2*( 1 );
  else if distribution="Gamma" then aic = -2*value + 2*( 1 + 2);
  else aic = -2*value + 2*( 1 + 1);
run;
proc print data=test2 noobs;
run;

type           value    distribution      aic

  1       -81.204342    Exponential     164.409
  2       -68.653867    Exponential     139.308
  1       -72.879087    Weibull         149.758
  2       -68.420282    Weibull         140.841
  1       -71.723310    LLogistic       147.447
  2       -67.146462    LLogistic       138.293
  1       -71.186940    Lognormal       146.374
  2       -66.847574    Lognormal       137.695
  1       -70.892978    Gamma           147.786
  2       -66.780969    Gamma           139.562
The last part of the output related to Gamma distribution is obtained by running the lifereg procedure and computing the Wald test statistic manually.
ods output ParameterEstimates (match_all=bytype persist=proc) = table12_5b;
proc lifereg data = sec1_9;
  model time*ind(0)= / distribution=gamma;
  by type;
run;
ods output close;

data waldtest;
  set &bytype;
  keep estimate stderr test0 test1;
  if parameter="Shape";
  test0 = 1- probchi(estimate**2/stderr**2,1);
  test1 = 1- probchi((estimate-1)**2/stderr**2,1);
run;
proc print data=waldtest noobs;
run;

Estimate      StdErr     test0       test1

 -0.6331      0.8264    0.44363    0.048146
 -0.2613      0.7253    0.71865    0.08202
The bottom table on page 387.
data sec1_9b;
  set sec1_9;
  z1 = type - 1;
run;
proc lifereg data = sec1_9b;
  model time*ind(0)=z1 /distribution=lnormal;
 run;
 The LIFEREG Procedure

           Model Information

Data Set                    WORK.SEC1_9B
Dependent Variable             Log(time)
Censoring Variable                   ind
Censoring Value(s)                     0
Number of Observations               101
Noncensored Values                    50
Right Censored Values                 51
Left Censored Values                   0
Interval Censored Values               0
Name of Distribution           Lognormal
Log Likelihood              -141.8636186

       Type III Analysis of Effects

                         Wald
Effect       DF    Chi-Square    Pr > ChiSq

z1            1        0.0133        0.9080

                    Analysis of Parameter Estimates

                          Standard   95% Confidence     Chi-
Parameter     DF Estimate    Error       Limits       Square Pr > ChiSq

Intercept      1   3.1774   0.3552   2.4813   3.8735   80.04     <.0001
z1             1   0.0535   0.4629  -0.8537   0.9607    0.01     0.9080
Scale          1   2.0843   0.2299   1.6791   2.5873
Table 12.6 on page 388, making use of the ODS feature and proc tabulate for a nicer output.
ods output ParameterEstimates (match_all=bydist persist=proc) = table12_6;
proc lifereg data = table12_1;
  model time*death(0)= z1 z2 z3 age / distribution=exponential;
run;
proc lifereg data = table12_1;
  model time*death(0)= z1 z2 z3 age / distribution=weibull;
run;
proc lifereg data = table12_1;
  model time*death(0)= z1 z2 z3 age / distribution=llogistic;
run;
proc lifereg data = table12_1;
  model time*death(0)= z1 z2 z3 age / distribution=lognormal;
run;
proc lifereg data = table12_1;
  model time*death(0)= z1 z2 z3 age / distribution=gamma;
run;
ods output close;
data table126;
  set &bydist;
  retain group 0;
  keep parameter estimate stderr group;
  if parameter = "Intercept" then group= group+1;
run;
proc format;
  value group 1 = "Exponential"
              2 = "Weibull"
			  3 = "Log Logistic"
			  4 = "Log Normal"
			  5 = "Gamma";
run;
options nocenter  FORMCHAR='|----|+|---+=|-/<>*';
proc tabulate data=table126;
  format group group.;
  class group parameter;
  var estimate stderr;
  table parameter='', group=' '*(estimate='Est' stderr='SE')*sum=' '*f=5.3/RTS=13;
run;

-------------------------------------------------------------------------
|           |           |           |    Log    |           |           |
|           |Exponential|  Weibull  | Logistic  |Log Normal |   Gamma   |
|           |-----------+-----------+-----------+-----------+-----------|
|           | Est | SE  | Est | SE  | Est | SE  | Est | SE  | Est | SE  |
|-----------+-----+-----+-----+-----+-----+-----+-----+-----+-----+-----|
|Intercept  |3.755|0.990|3.529|0.904|3.102|0.953|3.383|0.936|3.453|0.944|
|-----------+-----+-----+-----+-----+-----+-----+-----+-----+-----+-----|
|Scale      |1.000|0.000|0.885|0.108|0.715|0.086|1.264|0.135|1.104|0.257|
|-----------+-----+-----+-----+-----+-----+-----+-----+-----+-----+-----|
|Shape      |    .|    .|    .|    .|    .|    .|    .|    .|0.458|0.584|
|-----------+-----+-----+-----+-----+-----+-----+-----+-----+-----+-----|
|Weibull    |     |     |     |     |     |     |     |     |     |     |
|Shape      |1.000|0.000|1.130|0.138|    .|    .|    .|    .|    .|    .|
|-----------+-----+-----+-----+-----+-----+-----+-----+-----+-----+-----|
|age        |-.020|0.014|-.017|0.013|-.015|0.014|-.018|0.014|-.018|0.014|
|-----------+-----+-----+-----+-----+-----+-----+-----+-----+-----+-----|
|z1         |-.146|0.460|-.148|0.408|-.126|0.415|-.199|0.442|-.158|0.431|
|-----------+-----+-----+-----+-----+-----+-----+-----+-----+-----+-----|
|z2         |-.648|0.355|-.587|0.320|-.806|0.354|-.900|0.363|-.758|0.394|
|-----------+-----+-----+-----+-----+-----+-----+-----+-----+-----+-----|
|z3         |-1.64|0.399|-1.54|0.363|-1.77|0.426|-1.86|0.443|-1.73|0.449|
------------------------------------------------------------------------|
The rest of the output from Table 12.6 can be obtained from the following.
ods output ModelInfo (match_all=bydist persist=proc) = table126_mod;
proc lifereg data = table12_1;
  model time*death(0)= z1 z2 z3 age / distribution=exponential;
run;
proc lifereg data = table12_1;
  model time*death(0)= z1 z2 z3 age / distribution=weibull;
run;
proc lifereg data = table12_1;
  model time*death(0)= z1 z2 z3 age / distribution=llogistic;
run;
proc lifereg data = table12_1;
  model time*death(0)= z1 z2 z3 age / distribution=lognormal;
run;
proc lifereg data = table12_1;
  model time*death(0)= z1 z2 z3 age / distribution=gamma;
run;
ods output close;

data table126btm;
  set &bydist;
  lagv = lag(cvalue1);
  if label1 = "Log Likelihood" or label1="Name of Distribution";
  keep nvalue1 aic;
  if lagv = "Exponential" then aic = -2*nvalue1 + 2*( 1+4 );
  else if lagv = "Gamma" then aic = -2*nvalue1 + 2*( 1 + 2 +4);
  else aic = -2*nvalue1 + 2*( 1 + 1 +4);
  if nvalue1 ~=.;
run;
data table126btm1;
  set table126btm;
  id = _n_;
run;
proc format;
  value group 1 = "Exponential"
              2 = "Weibull"
	      3 = "Log Logistic"
	      4 = "Log Normal"
	      5 = "Gamma";
run;
proc print data=table126btm1(rename=(nvalue1=LogL)) noobs;
format id group.;
var id LogL AIC;
run;
Obs    id                      LogL      aic

 1     Exponential      -108.501123    227.002
 2     Weibull          -108.026745    228.053
 3     Log Logistic     -108.192374    228.385
 4     Log Normal       -107.995034    227.990
 5     Gamma            -107.680270    229.361
Section 12.5: Diagnostic Methods for Parametric Models
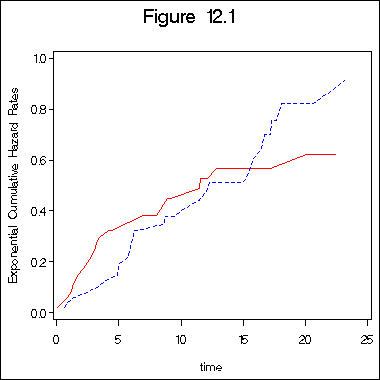
Example 12.1 (continued) Figure 12.1 on page 390. In this example, we first create a data set containing the estimates on survivals for both groups. Then we create all the necessary variables for different distributions of different plots.
proc phreg data =sec1_9;
  model time*ind(0) = ;
  where type = 1;
  output out = surv1 survival=surv1 /method = ch ;
run;
proc phreg data =sec1_9;
  model time*ind(0) = ;
  where type = 2;
  output out = surv2 survival=surv2 /method = ch ;
run;
data surv1_9;
  merge surv1 surv2;
  by time;
  haz1 = -log (surv1);/*Exponential*/
  haz2 = -log (surv2);
  lghaz1 = log(haz1); /*Weibull*/
  lghaz2 = log(haz2);
  lgtime = log(time);
  lnhaz1 = probit(1-exp(-haz1));
  lnhaz2 = probit(1-exp(-haz2));
  lohaz1 = log(exp(haz1)-1);
  lohaz2 = log(exp(haz2)-1);
run;

title "Figure 12.1";
symbol1 c=red i=l1p l=1;
symbol2 c=blue i=l1p l=2 ;
axis1 order =(0 to 25 by 5) minor = none;
axis2 order =(0 to 1 by .2) minor = none label =(a=90);
proc gplot data = surv1_9;
  plot haz1*time = 1 haz2*time =2 /overlay haxis = axis1 vaxis=axis2;
  label haz1 = "Exponential Cumulative Hazard Rates";
run;
quit;
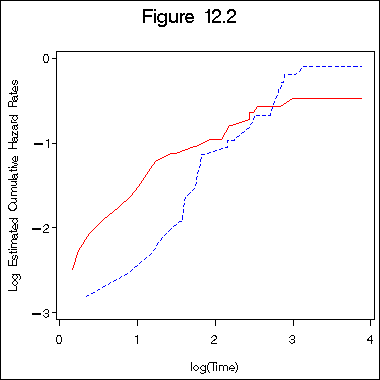
Figure 12.2 on page 391 on Weibull distribution.
title "Figure 12.2";
symbol1 c=red i=l1p l=1;
symbol2 c=blue i=l1p l=2 ;
axis1 order =(0 to 4 by 1) minor = none;
axis2 order =(-3 to 0 by 1) minor = none label =(a=90);
proc gplot data = surv1_9;
  plot lghaz1*lgtime = 1 lghaz2*lgtime =2 /overlay haxis = axis1 vaxis=axis2;
  label lghaz1 = "Log Estimated Cumulative Hazard Rates";
  label lgtime ="log(Time)";
run;
quit;
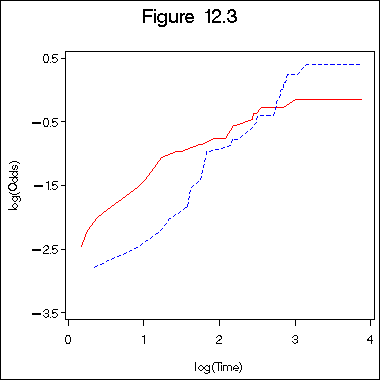
Figure 12.3 on page 392 of log logistic plot. The variables in the proc gplot are defined earlier.
title "Figure 12.3";
symbol1 c=red i=l1p l=1;
symbol2 c=blue i=l1p l=2 ;
axis1 order =(0 to 4 by 1) minor = none;
axis2 order =(-3.5 to 0.5 by 1) minor = none label =(a=90);
proc gplot data = surv1_9;
  plot lohaz1*lgtime = 1 lohaz2*lgtime =2 /overlay haxis = axis1 vaxis=axis2;
  label lohaz1 = "log(Odds)";
  label lgtime="log(Time)";
run;
quit;
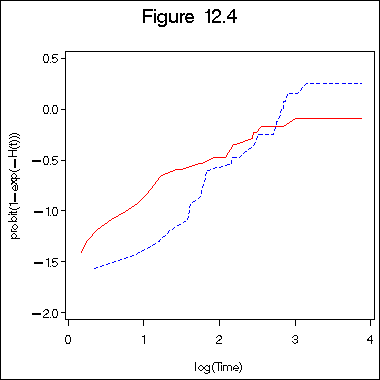
Figure 12. 4 on page 393 of log normal hazard plot.
title "Figure 12.4";
symbol1 c=red i=l1p l=1;
symbol2 c=blue i=l1p l=2 ;
axis1 order =(0 to 4 by 1) minor = none;
axis2 order =(-2 to 0.5 by .5) minor = none label =(a=90);
proc gplot data = surv1_9;
  plot lnhaz1*lgtime = 1 lnhaz2*lgtime =2 /overlay haxis = axis1 vaxis=axis2;
  label lnhaz1 = "probit(1-exp(-H(t)))";
  label lgtime="log(Time)";
run;
quit;
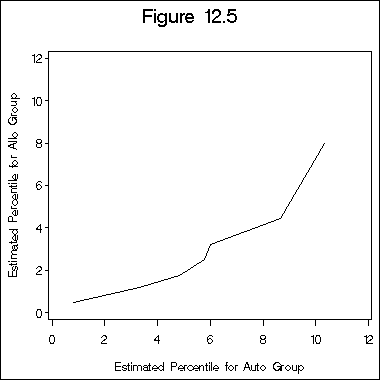
Figure 12.5 on page 394 is a quantile-quantile plot.
proc lifetest data =sec1_9 outsurv=surv1 (keep=time survival);
  time time*ind(0) ;
  where type = 1;
run;
proc lifetest data =sec1_9 outsurv=surv2 (keep=time survival);
  time time*ind(0) ;
  where type = 2;
run;
data type1;
  set surv1;
  retain time1  0;
  do i = 1 to 7;
  if  .05*(i-1) < 1- survival <.05*i then do p1=i; time1 = time; end;
  end;
  if p1 ~=.;
  keep time1  p1 ;
run;
proc sql;
  create table type1p as
  select max(time1) as time, p1 as p
  from type1
  group by p1;
quit;

data type2;
  set surv2;
  retain time2  0;
  do i = 1 to 7;
  if  .05*(i-1) < 1- survival <.05*i then do p2=i; time2 = time; end;
  end;
  if p2 ~=.;
  keep time2  p2 ;
run;
proc sql;
  create table type2p as
  select max(time2) as time, p2 as p
  from type2
  group by p2;
quit;

proc sql;
  create table comb2 as
  select s1.time as time1, s2.time as time2
  from type1p as s1, type2p as s2
  where s1.p=s2.p;
quit;

symbol i = join v=none;
axis1 order=(0 to 12 by 2) minor=none;
axis2 order=(0 to 12 by 2) minor=none label=(a=90);
title "Figure 12.5";
proc gplot data=comb2;
plot time1*time2 /haxis=axis1 vaxis=axis2;
label time1 ="Estimated Percentile for Allo Group";
label time2 = "Estimated Percentile for Auto Group";
run;
quit;
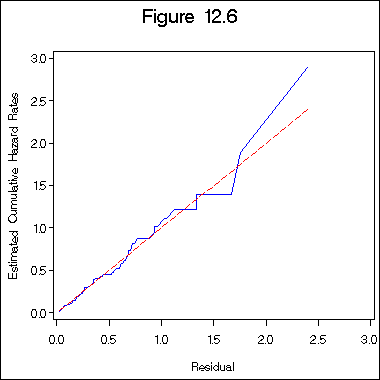
Figure 12.6 on page 395 of Cox-Snell residual plot.
proc reliability data =table12_1;
  distribution exponential;
  model time*death(0) = z1 z2 z3 age /obstats (survival) ;
  ods output  ModObstats = figure12_6;
run;
data figure12_6a;
  set figure12_6;
  h = -log(surv);
run;
proc phreg data = figure12_6a ;
  model  h*death(0) = ;
  output out = figure12_6b logsurv = ls /method = ch;
run;
data figure12_6c;
  set figure12_6b;
    haz = - ls;
run;
proc sort data = figure12_6c;
 by h;
run;
title "Figure 12.6";
axis1 order = (0 to 3 by .5) minor = none;
axis2 order = (0 to 3 by .5) minor = none label = ( a=90);
symbol1 i = i=l1p  c= blue;
symbol2 i = join c = red l = 3;
proc gplot data = figure12_6c;
  plot haz*h =1 h*h =2 /overlay haxis=axis1 vaxis= axis2;
  label haz = "Estimated Cumulative Hazard Rates";
  label h = "Residual";
run;
quit;
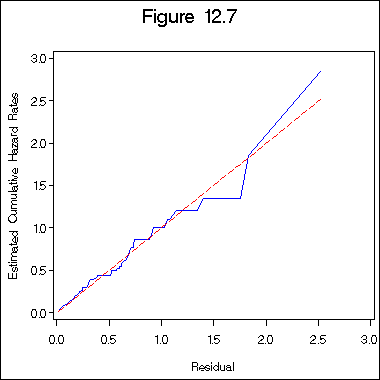
Figure 12.7 on page 396 of the Weibull regression model.
proc reliability data =table12_1;
  distribution weibull;
  model time*death(0) = z1 z2 z3 age /obstats (survival) ;
  ods output  ModObstats = figure12_6;
run;
data figure12_6a;
  set figure12_6;
  h = -log(surv);
run;
proc phreg data = figure12_6a ;
  model  h*death(0) = ;
  output out = figure12_6b logsurv = ls /method = ch;
run;
data figure12_6c;
  set figure12_6b;
    haz = - ls;
run;
proc sort data = figure12_6c;
 by h;
run;
title "Figure 12.7";
axis1 order = (0 to 3 by .5) minor = none;
axis2 order = (0 to 3 by .5) minor = none label = ( a=90);
symbol1 i = i=l1p  c= blue;
symbol2 i = join c = red l = 3;
proc gplot data = figure12_6c;
  plot haz*h =1 h*h =2 /overlay haxis=axis1 vaxis= axis2;
  label haz = "Estimated Cumulative Hazard Rates";
  label h = "Residual";
run;
quit;
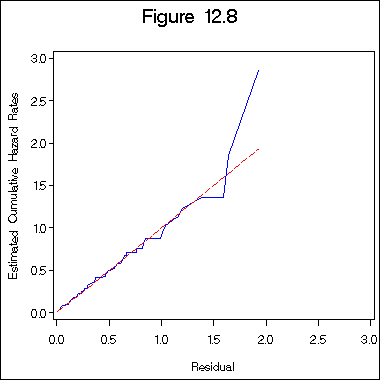
Figure 12.8 on page 397 of log logistic regression model.
proc reliability data =table12_1;
  distribution llogit;
  model time*death(0) = z1 z2 z3 age /obstats (survival) ;
  ods output  ModObstats = figure12_6;
run;
data figure12_6a;
  set figure12_6;
  h = -log(surv);
run;
proc phreg data = figure12_6a ;
  model  h*death(0) = ;
  output out = figure12_6b logsurv = ls /method = ch;
run;
data figure12_6c;
  set figure12_6b;
    haz = - ls;
run;
proc sort data = figure12_6c;
 by h;
run;

title "Figure 12.8";
axis1 order = (0 to 3 by .5) minor = none;
axis2 order = (0 to 3 by .5) minor = none label = ( a=90);
symbol1 i = i=l1p  c= blue;
symbol2 i = join c = red l = 3;
proc gplot data = figure12_6c;
  plot haz*h =1 h*h =2 /overlay haxis=axis1 vaxis= axis2;
  label haz = "Estimated Cumulative Hazard Rates";
  label h = "Residual";
run;
quit;
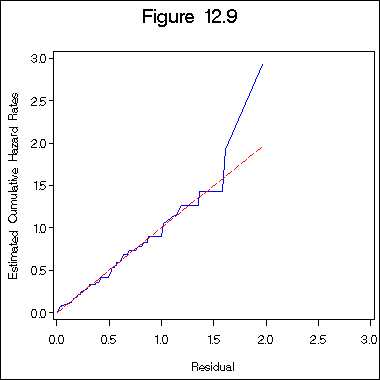
Figure 12.9 on page 398 of log normal regression model.
proc reliability data =table12_1;
  distribution lognormal;
  model time*death(0) = z1 z2 z3 age /obstats (survival) ;
  ods output  ModObstats = figure12_6;
run;
data figure12_6a;
  set figure12_6;
  h = -log(surv);
run;
proc phreg data = figure12_6a ;
  model  h*death(0) = ;
  output out = figure12_6b logsurv = ls /method = ch;
run;
data figure12_6c;
  set figure12_6b;
    haz = - ls;
run;
proc sort data = figure12_6c;
 by h;
run;

title "Figure 12.9";
axis1 order = (0 to 3 by .5) minor = none;
axis2 order = (0 to 3 by .5) minor = none label = ( a=90);
symbol1 i = i=l1p  c= blue;
symbol2 i = join c = red l = 3;
proc gplot data = figure12_6c;
  plot haz*h =1 h*h =2 /overlay haxis=axis1 vaxis= axis2;
  label haz = "Estimated Cumulative Hazard Rates";
  label h = "Residual";
run;
quit;
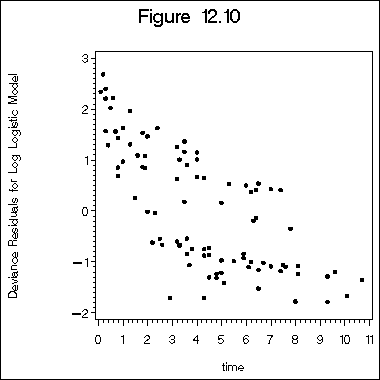
Figure 12.10 on page 399 of deviance residuals.
proc reliability data =table12_1;
  distribution llogit;
  model time*death(0) = z1 z2 z3 age /obstats (DRESID) ;
  ods output  ModObstats = figure12_6;
run;
proc sort data=figure12_6;
by time;
run;
symbol v=dot h=1.5 c=black i=none;
axis1 order = (-2 to 3 by 1) label=(a = 90) ;
title "Figure 12.10";
proc gplot data = figure12_6;
  plot dresid*time /vaxis=axis1;
  label dresid="Deviance Residuals for Log Logistic Model";
run;
quit;

