Section 4.2: Estimators of the Survival and Cumulative Hazard Functions for Right-Censored Data
data sec1_2;
input pair status time_p time_mp censor;
cards;
1  1  1 10 1
2  2  22 7 1
3  2  3 32 0
4  2 12 23 1
5  2  8 22 1
6  1 17  6 1
7  2  2 16 1
8  2 11 34 0
9  2  8 32 0
10 2 12 25 0
11 2  2 11 0
12 1  5 20 0
13 2  4 19 0
14 2  15 6 1
15 2  8 17 0
16 1 23 35 0
17 1  5  6 1
18 2 11 13 1
19 2  4  9 0
20 2  1  6 0
21 2  8 10 0
;
run;
Table 4.1A and Table 4.1B on page 85 shown together in the SAS output. Since this is explicitly a counting procedure, we use a data step here, instead of any procedures.
options nocenter nonumber nodate;
proc sql;
  create table raw_data as
  select  time_mp, sum(censor) as num_event, count(time_mp) as sub_total
  from sec1_2
  group by time_mp;
  quit;
data raw_data1;
  set raw_data ;
  total1 = lag(sub_total);
  retain num_left 21;
   if _n_ > 1 then do;
   num_left = - total1 + num_left; end;
   if num_event~=0;
   retain surv 1 delta 0;
   surv = surv*(1-num_event/num_left);
   delta= delta + num_event/(num_left*(num_left-num_event));
   var =(surv**2)*delta;
   stderr = var**.5;
   keep time_mp num_event num_left surv delta var stderr;
run;
title "Table 4.1A and Table4.1B";
proc print data = raw_data1 noobs;
run;
Table 4.1A and Table4.1B
            num_
time_mp    event    num_left      surv       delta        var       stderr

    6        3         21       0.85714    0.007937    0.005831    0.07636
    7        1         17       0.80672    0.011613    0.007558    0.08694
   10        1         15       0.75294    0.016375    0.009283    0.09635
   13        1         12       0.69020    0.023951    0.011409    0.10681
   16        1         11       0.62745    0.033042    0.013008    0.11405
   22        1          7       0.53782    0.056851    0.016444    0.12823
   23        1          6       0.44818    0.090184    0.018115    0.13459
Table 4.2 on page 86 based on the data set raw_data1 created in the previous example.
data table4_2;
  set raw_data1;
  retain h sigma2 0;
  h = h + num_event/num_left;
  sigma2 = sigma2 + num_event/num_left**2;
  stderr=sigma2**.5;
run;
title "Table 4.2";
proc print data = table4_2 noobs;
  var time_mp h sigma2 stderr;
run;
Table 4.2
time_mp       h        sigma2      stderr

    6      0.14286    0.006803    0.08248
    7      0.20168    0.010263    0.10131
   10      0.26835    0.014707    0.12127
   13      0.35168    0.021652    0.14715
   16      0.44259    0.029916    0.17296
   22      0.58545    0.050324    0.22433
   23      0.75211    0.078102    0.27947
Figure 4.1A on page 87 comparing the Nelson-Aalen and PL estimates.
data figure4_1a ;
  if _n_ =1 then do;
  time_mp = 0; surv=1; surv2=1; output; end;
  set table4_2 nobs=l;
  surv2=exp(-h); output;
  if _n_ = l then do ;
  time_mp=30; surv=surv; surv2 = surv2; output; end;
run;

symbol1 i=steplj c=blue;
symbol2 i=steplj c=red l=4;
axis1 label=(a=90) order=(0 to 1 by .2) minor=none;
axis2 order=(0 to 30 by 10) minor=none;
title "Figure 4.1A";
proc gplot data = figure4_1a;
  plot surv*time_mp = 1 surv2*time_mp = 2/overlay haxis=axis2 vaxis=axis1;
  label time_mp="Weeks";
  label surv="Survival Function";
run;
quit;
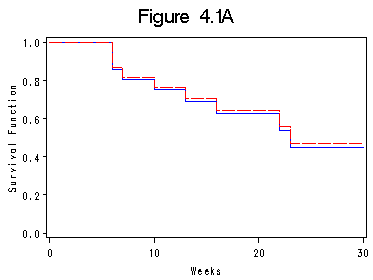
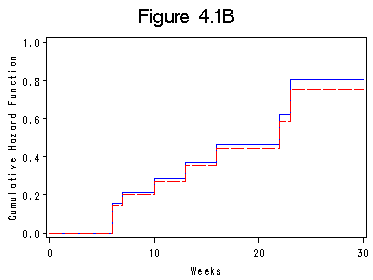
Figure 4.1B on page 88.
data figure4_1b ;
  if _n_ =1 then do;
  time_mp = 0; h_na=0; h_pl=0; output; end;
  set table4_2 nobs=l;
  h_pl = -log(surv);
  h_na = h ; output;
  if _n_ = l then do ;
  time_mp=30; h_na =h_na; h_pl = h_pl; output; end;
run;

title "Figure 4.1B";
symbol1 i=steplj c=blue;
symbol2 i=steplj c=red l=4;
axis1 label=(a=90) order=(0 to 1 by .2) minor=none;
axis2 order=(0 to 30 by 10) minor=none;
proc gplot data = figure4_1b;
  plot h_pl*time_mp = 1 h_na*time_mp = 2/overlay haxis=axis2 vaxis=axis1;
  label time_mp="Weeks";
  label h_pl="Cumulative Hazard Function";
run;
quit;
Table 4.3 on page 89 based on the bone marrow transplant data set. A data step creates a data set called bone_marrow and it can be downloaded here.
proc sql;
  create table raw_data3 as
  select  t2, sum(dfree) as num_event, count(t2) as sub_total
  from bone_marrow
  where g = 1
  group by t2;
  quit;
data table4_3;
  set raw_data3 nobs = all;
  total1 = lag(sub_total);
  retain num_left 38;
   if _n_ > 1 then do;
   num_left = - total1 + num_left; end;
   retain surv 1 delta  h sigma2 0;
   surv = surv*(1-num_event/num_left);
   delta= delta + num_event/(num_left*(num_left-num_event));
   var =(surv**2)*delta;
   stderr = var**.5;
   h = h + num_event / num_left;
   sigma2 = sigma2 + num_event /(num_left)**2;
   stderrh = sigma2**.5;
   keep t2 num_event num_left surv stderr h stderrh;
   if num_event~=0 or _n_ = all;
run;
proc print data = table4_3 noobs;
  var t2 num_event num_left surv stderr h stderrh;
run;
         num_
  t2    event    num_left      surv      stderr        h       stderrh

   1      1         38       0.97368    0.025967    0.02632    0.02632
  55      1         37       0.94737    0.036224    0.05334    0.03772
  74      1         36       0.92105    0.043744    0.08112    0.04685
  86      1         35       0.89474    0.049784    0.10969    0.05487
 104      1         34       0.86842    0.054836    0.13910    0.06226
 107      1         33       0.84211    0.059153    0.16941    0.06924
 109      1         32       0.81579    0.062886    0.20066    0.07597
 110      1         31       0.78947    0.066135    0.23291    0.08253
 122      2         30       0.73684    0.071434    0.29958    0.09505
 129      1         28       0.71053    0.073570    0.33530    0.10153
 172      1         27       0.68421    0.075405    0.37233    0.10808
 192      1         26       0.65789    0.076960    0.41079    0.11472
 194      1         25       0.63158    0.078252    0.45079    0.12149
 230      1         23       0.60412    0.079522    0.49427    0.12904
 276      1         22       0.57666    0.080509    0.53973    0.13681
 332      1         21       0.54920    0.081223    0.58735    0.14486
 383      1         20       0.52174    0.081672    0.63735    0.15325
 418      1         19       0.49428    0.081860    0.68998    0.16203
 466      1         18       0.46682    0.081788    0.74553    0.17129
 487      1         17       0.43936    0.081457    0.80436    0.18111
 526      1         16       0.41190    0.080862    0.86686    0.19159
 609      1         14       0.38248    0.080260    0.93829    0.20447
 662      1         13       0.35306    0.079296    1.01521    0.21846
2081      0          1       0.35306    0.079296    1.01521    0.21846
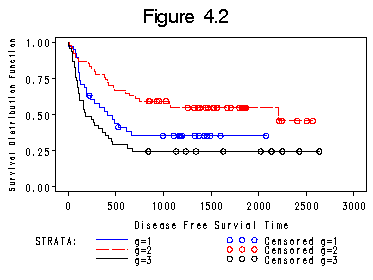
Figure 4.2 on page 90.
proc lifetest data = bone_marrow plots = (s) graphics;
  time t2*dfree(0);
  strata g;
  title "Figure 4.2";
  symbol v= none;
run;
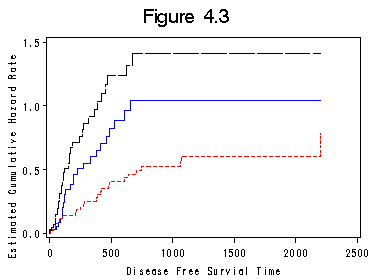
Figure 4.3 on page 91. Proc lifetest has an option for output the cumulative hazard rate plot. But the plot is not in the style of step functions. Here we introduce another way for creating the plot.
proc lifetest data = bone_marrow outsurv = figure4_3;
  time t2*dfree(0);
  strata g;
run;
proc sort data = figure4_3 out=figure4_3a;
  by t2;
  where survival~=.;
proc transpose data = figure4_3a out= figure4_3b prefix=surv;
  format g 2.;
  by t2 ;
  id  g ;
  var  survival;
run;
data fig4_3;
  set figure4_3b ;
  retain h1-h3 0;
  if surv1 ~= . then h1 = -log(surv1);
  if surv2 ~= . then h2 = -log(surv2);
  if surv3 ~= . then h3 = -log(surv3);
run;
goptions reset = all;
title "Figure 4.3";
  symbol1  i = stepjl l = 1 c = blue;
  symbol2  i = stepjl l = 2 c = red;
  symbol3  i = stepjl l = 5 c = black;
axis1 order = (0 to 2500 by 500) minor = none;
axis2 order = (0.0 to 1.5 by .5) minor = none label = ( a= 90);
proc gplot data = fig4_3;
  plot h1*t2 =1 h2*t2=2 h3*t2=3 /overlay haxis = axis1 vaxis = axis2;
  label h1 = "Estimated Cumulative Hazard Rate";
run;
quit;
Section 4.3: Pointwise Confidence Intervals for Survival Function
Table 4.4. We only produced the first column for the ALL group. The other two groups will be the same. The proc sql part creates a data set that is used to in the next data step to create a life table. The last data step creates different types of confidence intervals.
proc sql;
  create table table4_4_1 as
  select  t2, sum(dfree) as num_event, count(t2) as sub_total
  from bone_marrow
  where g = 1
  group by t2;
  quit;
data table4_4;
  set table4_4_1 nobs = all;
  total1 = lag(sub_total);
  retain num_left 38;
   if _n_ > 1 then do;
   num_left = - total1 + num_left; end;
   retain surv 1 delta  h sigma2 0;
   surv = surv*(1-num_event/num_left);
   delta= delta + num_event/(num_left*(num_left-num_event));
   var =(surv**2)*delta;
   stderr = var**.5;
   h = h + num_event / num_left;
   sigma2 = sigma2 + num_event /(num_left)**2;
   stderrh = sigma2**.5;
   if num_event~=0 or _n_ = all;
run;
data table4_4_1a;
  set table4_4;
  if surv ~=. then sigma = stderr / surv;
  md = probit(1-.05/2)*sigma ;
  linearL = surv - md * surv;
  linearU = surv + md * surv;
  logL = surv**( 1 / (exp( md /log(surv))));
  logU = surv**(exp( md /(log(surv))));
  sinL = (sin(max(0, arsin(surv**.5) - .5 * md *(surv/(1-surv))**.5)))**2;
  sinU = (sin(min(CONSTANT('PI') /2, arsin(surv**.5) + .5 * md *(surv/(1-surv))**.5)))**2;
run;
title;
proc print  data = table4_4_1a noobs;
 var t2 surv var stderr sigma;
 var linearL linearU;
 var logL logU ;
 var sinL sinU;
 where t2 = 332;
run;
 t2      surv            var     stderr      sigma
 332    0.54920    .006597211    0.081223    0.14789

 linearL    linearU      logL       logU       sinL       sinU
 0.39000    0.70839    0.37830    0.69110    0.39021    0.70319
Section 4.4 Confidence Bands for the Survival Function
Table 4.5 on page 102. We are going to input the confidence coefficient created in Appendix C manually in our data step. This calculation is based on the previous calculation on survival function estimate. So we are going to use the data set table4_4 created from last section. We omit the code for table 4.6 since we are going to do for Figure 4.5 below.
data table4_5_ep;
  set table4_4;
  if surv ~=. then sigma = stderr / surv;
  md = 2.8826*sigma ;
  linearL = surv - md * surv;
  linearU = surv + md * surv;
  logL = surv**( 1 / (exp( md /log(surv))));
  logU = surv**(exp( md /(log(surv))));
  sinL = (sin(max(0, arsin(surv**.5) - .5 * md *(surv/(1-surv))**.5)))**2;
  sinU = (sin(min(CONSTANT('PI') /2, arsin(surv**.5) + .5 * md *(surv/(1-surv))**.5)))**2;
  if 100 <=t2 <=600 ;
run;
proc print data=table4_5_ep noobs;
var t2 surv stderr sigma2 linearL linearU logL logU sinL sinU;
run;
t2      surv      stderr      sigma2     linearL    linearU      logL       logU       sinL       sinU

104    0.86842    0.054836    0.003876    0.71035    1.02649    0.59893    0.96192    0.67650    0.98124
107    0.84211    0.059153    0.004794    0.67159    1.01262    0.57218    0.94848    0.64101    0.96975
109    0.81579    0.062886    0.005771    0.63451    0.99706    0.54531    0.93393    0.60715    0.95663
110    0.78947    0.066135    0.006811    0.59883    0.98011    0.51864    0.91841    0.57463    0.94216
122    0.73684    0.071434    0.009034    0.53093    0.94276    0.46648    0.88488    0.51292    0.90991
129    0.71053    0.073570    0.010309    0.49845    0.92260    0.44110    0.86702    0.48350    0.89235
172    0.68421    0.075405    0.011681    0.46685    0.90157    0.41623    0.84849    0.45491    0.87396
192    0.65789    0.076960    0.013160    0.43605    0.87974    0.39186    0.82933    0.42710    0.85479
194    0.63158    0.078252    0.014760    0.40601    0.85715    0.36801    0.80958    0.40002    0.83489
230    0.60412    0.079522    0.016651    0.37489    0.83335    0.34300    0.78869    0.37196    0.81382
276    0.57666    0.080509    0.018717    0.34458    0.80873    0.31869    0.76720    0.34472    0.79199
332    0.54920    0.081223    0.020984    0.31507    0.78333    0.29504    0.74510    0.31826    0.76944
383    0.52174    0.081672    0.023484    0.28631    0.75717    0.27206    0.72242    0.29256    0.74618
418    0.49428    0.081860    0.026254    0.25831    0.73025    0.24972    0.69915    0.26760    0.72221
466    0.46682    0.081788    0.029341    0.23106    0.70258    0.22803    0.67531    0.24337    0.69754
487    0.43936    0.081457    0.032801    0.20455    0.67417    0.20698    0.65088    0.21988    0.67216
526    0.41190    0.080862    0.036707    0.17881    0.64499    0.18660    0.62586    0.19712    0.64607
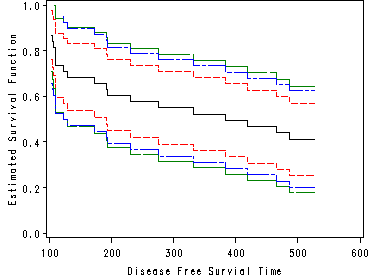
Figure 4.5 on page 104.
data figure4_5;
  set table4_4;
  if surv ~=. then sigma = stderr / surv;
  md = probit(1-.05/2)*sigma ;
  md1 = 2.8826*sigma ;
  md2 = 1.3211*(1+38*sigma2)/38**.5;
  pointL = surv - md * surv;
  pointU = surv + md * surv;
  epL = surv - md1*surv;
  epU = surv + md1*surv;
  hwL = surv - md2*surv;
  hwU = surv + md2*surv;
  if 100 <=t2 <=600 ;
run;

symbol1 value = none line = 1 i = stepjr color = black;
symbol2 value = none line = 3 i = stepjr color = red;
symbol3 value = none line = 3 i = stepjr color = red;
symbol4 value = none line = 7 i = stepjr color = green;
symbol5 value = none line = 7 i = stepjr color = green;
symbol6 value = none line = 9 i = stepjr color = blue;
symbol7 value = none line = 9 i = stepjr color = blue;

proc gplot data=figure4_5;
 plot (surv pointU pointL epL epU hwL hwU )*t2 /overlay;
run;
quit;
Figure 4.6 on page 105.
data figure4_6;
  set table4_4;
  if surv ~=. then sigma = stderr / surv;
  md = probit(1-.05/2)* sigma ;
  md1 = 2.8826*sigma ;
  md2 = 1.3211*(1+38*sigma2)/38**.5;
  pointL = surv**( 1 / (exp( md /log(surv))));
  pointU = surv**(exp( md /(log(surv))));
  epL = surv**( 1 / (exp( md1 /log(surv))));
  epU = surv**(exp( md1 /(log(surv))));
  hwL = surv**( 1 / (exp( md2 /log(surv))));
  hwU = surv**(exp( md2 /(log(surv))));
  if 100 <=t2 <=600 ;
run;

proc gplot data=figure4_6;
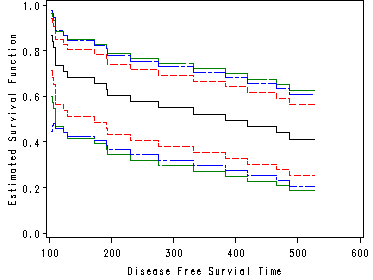
 plot (surv pointU pointL epL epU hwL hwU )*t2 /overlay haxis=axis1 vaxis=axis2;
 label surv="Estimated Survival Function";
run;
quit;
Figure 4.6 on page 105.
data figure4_7;
  set table4_4;
  if surv ~=. then sigma = stderr / surv;
  md = probit(1-.05/2)* sigma ;
  md1 = 2.8826*sigma ;
  md2 = 1.3211*(1+38*sigma2)/38**.5;
  pointL = (sin(max(0, arsin(surv**.5) - .5 * md *(surv/(1-surv))**.5)))**2;
  pointU = (sin(min(CONSTANT('PI') /2, arsin(surv**.5) + .5 * md *(surv/(1-surv))**.5)))**2;
  epL = (sin(max(0, arsin(surv**.5) - .5 * md1 *(surv/(1-surv))**.5)))**2;
  epU = (sin(min(CONSTANT('PI') /2, arsin(surv**.5) + .5 * md1 *(surv/(1-surv))**.5)))**2;
  hwL = (sin(max(0, arsin(surv**.5) - .5 * md2 *(surv/(1-surv))**.5)))**2;
  hwU = (sin(min(CONSTANT('PI') /2, arsin(surv**.5) + .5 * md2 *(surv/(1-surv))**.5)))**2;
  if 100 <=t2 <=600 ;
run;

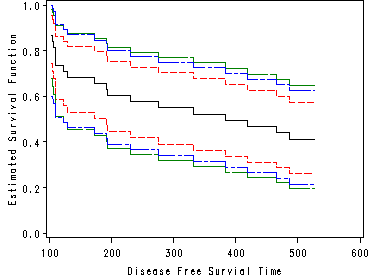
proc gplot data=figure4_7;
 plot (surv pointU pointL epL epU hwL hwU )*t2 /overlay haxis=axis1 vaxis=axis2;
 label surv="Estimated Survival Function";
run;
quit;
We omit the code for the rest of plots, since they are similar to what we have here.
Section 4.5 Point and Interval Estimates of the Mean and Median Survival Time
Example 4.1 on page 110. This uses the data set raw_data1 created in Section 4.1 for the survival function estimate.
proc sort data=raw_data1;
 by descending time_mp ;
run;
data exm110;
  set raw_data1 nobs = last;
  lagt = lag(time_mp);
  if _n_ = 1 then
  med = surv*(35 - time_mp);
  else med = surv*(lagt- time_mp); output;
  if _n_ =last then do; med = 6; output; end;
run;

data exm110a;
  set exm110 nobs=last;
  retain sumd var35 0 ;
  sumd = sumd + med;
  var35 = var35 + ( sumd**2 ) * num_event/(num_left*(num_left-num_event));
  if _n_ =last then var35=.;
run;

proc print data = exm110a noobs;
  var time_mp sumd var35;
run;

time_mp      sumd      var35

   23       5.3782    0.96415
   22       5.9160    1.79745
   16       9.6807    2.64941
   13      11.7513    3.69556
   10      14.0101    4.63024
    7      16.4303    5.62272
    6      17.2874    7.99457
    6      23.2874     .
Example 4.2 on page 111. The first row of the table. The other two rows can be obtained in the same fashion. This example uses the data set table4_4 created in Section 4.3 for the survival function estimate. In the following example, we didn’t use Enfron’s tail correction.
proc sort data=table4_4;
  by descending t2;
run;
proc sql;
  select min(t2) into :mint
  from table4_4;
quit;
data exm111;
  set table4_4 nobs = last;
  lagt = lag(t2);
  if _n_ = 1 then
  med = surv*(2081 - t2);
  else med = surv*(lagt- t2); output;
  if _n_ =last then do; med = &mint; output; end;
run;

data exm111a;
  set exm111 nobs=last;
  retain sumd vmean 0 ;
  sumd = sumd + med;
  vmean = vmean + ( sumd**2 ) * num_event/(num_left*(num_left-num_event));
  if _n_ =last then vmean=sqrt(vmean);
run;
data exm111b;
  set exm111a nobs=last;
  if _n_ =last then do;
  stderr = vmean;
  clow = sumd - 1.96*stderr;
  chigh = sumd + 1.96*stderr;
  end;
  if _n_ ~= last then delete;
run;
proc print data = exm111b noobs ;
  var sumd stderr clow chigh;
run;
  sumd      stderr      clow      chigh

899.225    148.086    608.977    1189.47
Section 4.6 Estimators of the Survival Function for Left-Truncated and Right-Censored Data
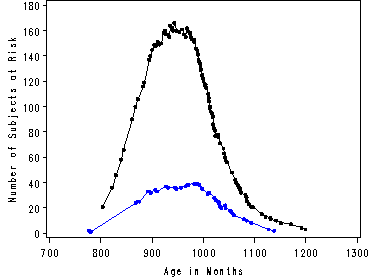
The following example is based on Channing House data which we created in a data step and called channing.
data c_male;
  set channing;
  cons = 1;
  if gender = 1;
run;
proc phreg data=c_male noprint;
  model  (age_entry, age_death)*death(0)=cons;
  output out=num_male num_left=num_left_male /method = pl;
run;

data c_female;
  set channing;
  cons = 1;
  if gender = 2;
run;
proc phreg data=c_female noprint;
  model  (age_entry, age_death)*death(0)=cons;
  output out=num_female num_left=num_left_female /method = pl;
run;
proc sort data=num_male;
  by age_death;
proc sort data=num_female;
  by age_death;
run;
data combined;
  merge num_male (in=male) num_female (in = female);
  by age_death;
run;

symbol1 i = join v = dot h = 0.5 c = black;
symbol2 i = join v = dot h = 0.5 c = blue;
axis1 order = (700 to 1300 by 100) minor = none;
axis2 order = (0 to 180 by 20) minor = none label = (a=90);
proc gplot data=combined;
  plot num_left_female*age_death = 1 num_left_male*age_death = 2
          /overlay haxis=axis1 vaxis=axis2;
  label age_death = "Age in Months";
run;
quit;

