Simple random sampling
page 29 Table 2.4 Estimates from a simple random sample drawn without replacement (n = 8); the Province’91 population.
data page29;
  input id cluster ue91 lab91;
  fpc = 32;
  wt = 4;
  strata = 1;
  cards;
  1 1 4123 33786
  2 4 760 5919
  3 5 721 4930
  4 15 142 675
  5 18 187 1448
  6 26 331 2543
  7 30 127 1084
  8 31 219 1330
  ;
run;
The code below gets the total and the standard deviation of the total for the variable ue91 as shown in the first line of the table. You can calculate the ratio by hand using the information in the output. We know of no way to get the median from proc surveymeans.
proc surveymeans data = page29 mean sum std cv r = .25;
  var ue91 lab91;
  weight wt;
  strata strata;
  cluster cluster;
run;
The SURVEYMEANS Procedure

            Data Summary

Number of Strata                   1
Number of Clusters                 8
Number of Observations             8
Sum of Weights                    32

                                       Statistics

                               Std Error        Coeff of
Variable            Mean         of Mean       Variation             Sum         Std Dev
----------------------------------------------------------------------------------------
ue91          826.250000      415.070586        0.502355           26440           13282
lab91        6464.375000     3430.088578        0.530614          206860          109763
----------------------------------------------------------------------------------------
Systematic sampling
page 46 Table 2.6 Estimates from a systematic sample drawn from the Province’91 population using implicit stratification.
NOTE: The standard error of the total is different from that shown in the text (the text shows 11802). However, we get the 13627 in each of the statistical packages in which we have tried to recreate this example.
data page44 ;
  input id str clu wt ue91 lab91 smplrat;
  fpc = 32;
  cards;
  1 1 1 4 4123 33786 .25
  2 1 5 4 721 4930 .25
  3 2 9 4 194 2069 .25
  4 2 13 4 129 927 .25
  5 2 17 4 239 2144 .25
  6 2 21 4 61 573 .25
  7 2 25 4 262 1737 .25
  8 2 29 4 166 1615 .25
  ;
run;
proc surveymeans data = page44 sum std;
  weight wt;
  strata str;
  cluster clu;
  var ue91;
run;
The SURVEYMEANS Procedure

            Data Summary

Number of Strata                   2
Number of Clusters                 8
Number of Observations             8
Sum of Weights                    32

               Statistics

Variable             Sum         Std Dev
----------------------------------------
ue91               23580           13627
----------------------------------------
page 60 Table 2.8 Estimates under a PPSSYS design (n = 8); the Province’91 population.
NOTE: The certainty PSU (the first line of the data) was entered twice and the weight was changed from 1 to .5 for each observation. This is necessary because you need to have two observations in each strata.
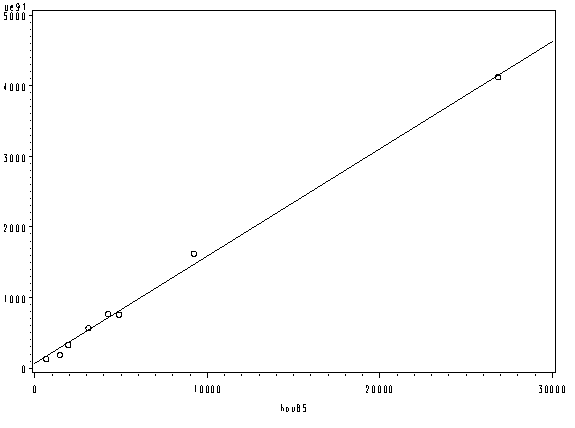
data page60;
  input id str clu wt hou85 ue91 lab91;
  fpc = 32;
  cards;
  1 2 1 0.5 26881 4123 33786
  2 2 1 0.5 26881 4123 33786
  3 1 10 1.004 9230 1623 13727
  4 1 4 1.893 4896 760 5919
  5 1 7 2.173 4264 767 5823
  6 1 32 2.971 3119 568 4011
  7 1 26 4.762 1946 331 2543
  8 1 18 6.335 1463 187 1448
  9 1 13 13.730 675 129 927
  ;
run;

proc sort data = page60;
  by str;
run;
proc surveymeans data = page60 sum std;
  weight wt;
  strata str;
  cluster clu;
  var ue91;
run;
The SURVEYMEANS Procedure

            Data Summary

Number of Strata                   2
Number of Clusters                 8
Number of Observations             9
Sum of Weights                33.868

               Statistics

Variable             Sum         Std Dev
----------------------------------------
ue91               15077      521.121241
----------------------------------------
The code below produces the graph on page 63.
goption reset = all;
symbol i=r v=circle;
proc gplot data = page60;
  plot ue91*hou85;
  run;
quit;