SAS output is rarely the form in which results are presented. Many create results tables in Excel. This page will provide an example of how to generate a multi-tab spreadsheet containing SAS results. We will be using the Output Delivery System (ODS) to do so. ODS allows you to generate tabular output from your raw output that can be placed into Excel sheets. In the code below, we are creating an Excel file (giving it a name and location), indicating a style to be used (“minimal” in this example), and specifying a few other options.
ODS TAGSETS.EXCELXP
file='D:\work\sas9regression.xls'
STYLE=minimal
OPTIONS ( Orientation = 'landscape'
FitToPage = 'yes'
Pages_FitWidth = '1'
Pages_FitHeight = '100' );
After this code, we can analyze our data and a new tab will be created for each separate ODS table from your output.
proc reg data = ats.hsb2;
  model write = female math read;
run;
quit;
proc format;
  value fm 1='Female' 0='Male' ;
  value ses 1='Low' 2='Middle' 3='High';
run;
After completing our analysis, we “close” the Excel file.
ods tagsets.excelxp close;
We can now open the Excel file and see the separate tabs for each ODS table.
The style indicated effects the appearance of the output we see in Excel. For example, we used the “minimal” style and we can look at the ANOVA table in the second tab for an example of this style:
To see a list of the available styles, run the SAS code below:
ods listing;
proc template;
list styles;
run;
quit;
We employed a few of the “options” to format our results in Excel. To see the full list of options, run the SAS code below:
filename temp temp;
ods tagsets.ExcelXP file=temp options(doc='help');
ods tagsets.ExcelXP close;
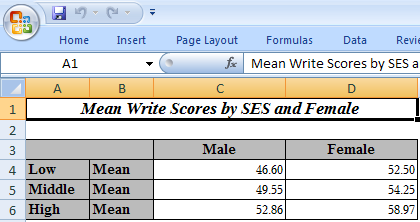
We can look at another style and some additional options. In the example code below, we create a two-way frequency table in SAS and output the results to Excel with the “printer” style and we have added a title to the output in Excel with the embedded_titles option in our ODS options statement.
ODS TAGSETS.EXCELXP
file='D:\work\sas9tab2.xls'
STYLE=Printer
OPTIONS ( Orientation = 'landscape'
FitToPage = 'yes'
Pages_FitWidth = '1'
Pages_FitHeight = '100'
embedded_titles = 'yes');

title 'Mean Write Scores by SES and Female';
proc format;
  value fm 1='Female' 0='Male' ;
  value ses 1='Low' 2='Middle' 3='High';
run;
proc tabulate data = ats.hsb2;
  class ses female;
  var write /style = {tagattr='format:000'};
  table ses=''*mean,
        write=''*[style={tagattr='format:#0.00'}]*female='' /  rtspace=42;
  format female fm. ses ses.;
run;
ods tagsets.excelxp close;
We can view these results to see how the “printer” style appears in Excel:
For further details on sending results from SAS to Excel, see Vincent DelGobbo’s paper Creating Multi-Sheet Excel Workbooks the Easy Way with SAS.


