Introduction
A typical use of a logarithmic transformation variable is to pull outlying data from a positively skewed distribution closer to the bulk of the data in a quest to have the variable be normally distributed. In regression analysis the logs of variables are routinely taken, not necessarily for achieving a normal distribution of the predictors and/or the dependent variable but for interpretability. The standard interpretation of coefficients in a regression analysis is that a one unit change in the independent variable results in the respective regression coefficient change in the expected value of the dependent variable while all the predictors are held constant. Interpreting a log transformed variable can be done in such a manner; however, such coefficients are routinely interpreted in terms of percent change (see Introductory Econometrics: A Modern Approach by Woolridge for discussion and derivation). Throughout this page we’ll explore the interpretation in a simple linear regression setting with either the dependent variable, independent variable, or both variables are log-transformed. We’ll use the hospital-level data from the Study on the Efficacy of Nosocomial Infection Control (data came from Applied Linear Regression Models 5th edition) where we’ll explore the relationship between average length of stay (in days) for all patients in the hospital (length) and the average daily number of patients in the hospital (census). The focus of this page is model interpretation, not model logistics.
NOTE: The ensuing interpretation is applicable for only log base e (natural log) transformations.
data senic;
input id length age risk culture xray beds msch region census nurses svcs;
datalines;
  1   7.13  55.7  4.1   9.0   39.6  279  2  4  207  241  60.0
  2   8.82  58.2  1.6   3.8   51.7   80  2  2   51   52  40.0
  3   8.34  56.9  2.7   8.1   74.0  107  2  3   82   54  20.0
  4   8.95  53.7  5.6  18.9  122.8  147  2  4   53  148  40.0
  5  11.20  56.5  5.7  34.5   88.9  180  2  1  134  151  40.0
  6   9.76  50.9  5.1  21.9   97.0  150  2  2  147  106  40.0
  7   9.68  57.8  4.6  16.7   79.0  186  2  3  151  129  40.0
  8  11.18  45.7  5.4  60.5   85.8  640  1  2  399  360  60.0
  9   8.67  48.2  4.3  24.4   90.8  182  2  3  130  118  40.0
 10   8.84  56.3  6.3  29.6   82.6   85  2  1   59   66  40.0
 11  11.07  53.2  4.9  28.5  122.0  768  1  1  591  656  80.0
 12   8.30  57.2  4.3   6.8   83.8  167  2  3  105   59  40.0
 13  12.78  56.8  7.7  46.0  116.9  322  1  1  252  349  57.1
 14   7.58  56.7  3.7  20.8   88.0   97  2  2   59   79  37.1
 15   9.00  56.3  4.2  14.6   76.4   72  2  3   61   38  17.1
 16  11.08  50.2  5.5  18.6   63.6  387  2  3  326  405  57.1
 17   8.28  48.1  4.5  26.0  101.8  108  2  4   84   73  37.1
 18  11.62  53.9  6.4  25.5   99.2  133  2  1  113  101  37.1
 19   9.06  52.8  4.2   6.9   75.9  134  2  2  103  125  37.1
 20   9.35  53.8  4.1  15.9   80.9  833  2  3  547  519  77.1
 21   7.53  42.0  4.2  23.1   98.9   95  2  4   47   49  17.1
 22  10.24  49.0  4.8  36.3  112.6  195  2  2  163  170  37.1
 23   9.78  52.3  5.0  17.6   95.9  270  1  1  240  198  57.1
 24   9.84  62.2  4.8  12.0   82.3  600  2  3  468  497  57.1
 25   9.20  52.2  4.0  17.5   71.1  298  1  4  244  236  57.1
 26   8.28  49.5  3.9  12.0  113.1  546  1  2  413  436  57.1
 27   9.31  47.2  4.5  30.2  101.3  170  2  1  124  173  37.1
 28   8.19  52.1  3.2  10.8   59.2  176  2  1  156   88  37.1
 29  11.65  54.5  4.4  18.6   96.1  248  2  1  217  189  37.1
 30   9.89  50.5  4.9  17.7  103.6  167  2  2  113  106  37.1
 31  11.03  49.9  5.0  19.7  102.1  318  2  1  270  335  57.1
 32   9.84  53.0  5.2  17.7   72.6  210  2  2  200  239  54.3
 33  11.77  54.1  5.3  17.3   56.0  196  2  1  164  165  34.3
 34  13.59  54.0  6.1  24.2  111.7  312  2  1  258  169  54.3
 35   9.74  54.4  6.3  11.4   76.1  221  2  2  170  172  54.3
 36  10.33  55.8  5.0  21.2  104.3  266  2  1  181  149  54.3
 37   9.97  58.2  2.8  16.5   76.5   90  2  2   69   42  34.3
 38   7.84  49.1  4.6   7.1   87.9   60  2  3   50   45  34.3
 39  10.47  53.2  4.1   5.7   69.1  196  2  2  168  153  54.3
 40   8.16  60.9  1.3   1.9   58.0   73  2  3   49   21  14.3
 41   8.48  51.1  3.7  12.1   92.8  166  2  3  145  118  34.3
 42  10.72  53.8  4.7  23.2   94.1  113  2  3   90  107  34.3
 43  11.20  45.0  3.0   7.0   78.9  130  2  3   95   56  34.3
 44  10.12  51.7  5.6  14.9   79.1  362  1  3  313  264  54.3
 45   8.37  50.7  5.5  15.1   84.8  115  2  2   96   88  34.3
 46  10.16  54.2  4.6   8.4   51.5  831  1  4  581  629  74.3
 47  19.56  59.9  6.5  17.2  113.7  306  2  1  273  172  51.4
 48  10.90  57.2  5.5  10.6   71.9  593  2  2  446  211  51.4
 49   7.67  51.7  1.8   2.5   40.4  106  2  3   93   35  11.4
 50   8.88  51.5  4.2  10.1   86.9  305  2  3  238  197  51.4
 51  11.48  57.6  5.6  20.3   82.0  252  2  1  207  251  51.4
 52   9.23  51.6  4.3  11.6   42.6  620  2  2  413  420  71.4
 53  11.41  61.1  7.6  16.6   97.9  535  2  3  330  273  51.4
 54  12.07  43.7  7.8  52.4  105.3  157  2  2  115   76  31.4
 55   8.63  54.0  3.1   8.4   56.2   76  2  1   39   44  31.4
 56  11.15  56.5  3.9   7.7   73.9  281  2  1  217  199  51.4
 57   7.14  59.0  3.7   2.6   75.8   70  2  4   37   35  31.4
 58   7.65  47.1  4.3  16.4   65.7  318  2  4  265  314  51.4
 59  10.73  50.6  3.9  19.3  101.0  445  1  2  374  345  51.4
 60  11.46  56.9  4.5  15.6   97.7  191  2  3  153  132  31.4
 61  10.42  58.0  3.4   8.0   59.0  119  2  1   67   64  31.4
 62  11.18  51.0  5.7  18.8   55.9  595  1  2  546  392  68.6
 63   7.93  64.1  5.4   7.5   98.1   68  2  4   42   49  28.6
 64   9.66  52.1  4.4   9.9   98.3   83  2  2   66   95  28.6
 65   7.78  45.5  5.0  20.9   71.6  489  2  3  391  329  48.6
 66   9.42  50.6  4.3  24.8   62.8  508  2  1  421  528  48.6
 67  10.02  49.5  4.4   8.3   93.0  265  2  2  191  202  48.6
 68   8.58  55.0  3.7   7.4   95.9  304  2  3  248  218  48.6
 69   9.61  52.4  4.5   6.9   87.2  487  2  3  404  220  48.6
 70   8.03  54.2  3.5  24.3   87.3   97  2  1   65   55  28.6
 71   7.39  51.0  4.2  14.6   88.4   72  2  2   38   67  28.6
 72   7.08  52.0  2.0  12.3   56.4   87  2  3   52   57  28.6
 73   9.53  51.5  5.2  15.0   65.7  298  2  3  241  193  48.6
 74  10.05  52.0  4.5  36.7   87.5  184  1  1  144  151  68.6
 75   8.45  38.8  3.4  12.9   85.0  235  2  2  143  124  48.6
 76   6.70  48.6  4.5  13.0   80.8   76  2  4   51   79  28.6
 77   8.90  49.7  2.9  12.7   86.9   52  2  1   37   35  28.6
 78  10.23  53.2  4.9   9.9   77.9  752  1  2  595  446  68.6
 79   8.88  55.8  4.4  14.1   76.8  237  2  2  165  182  48.6
 80  10.30  59.6  5.1  27.8   88.9  175  2  2  113   73  45.7
 81  10.79  44.2  2.9   2.6   56.6  461  1  2  320  196  65.7
 82   7.94  49.5  3.5   6.2   92.3  195  2  2  139  116  45.7
 83   7.63  52.1  5.5  11.6   61.1  197  2  4  109  110  45.7
 84   8.77  54.5  4.7   5.2   47.0  143  2  4   85   87  25.7
 85   8.09  56.9  1.7   7.6   56.9   92  2  3   61   61  45.7
 86   9.05  51.2  4.1  20.5   79.8  195  2  3  127  112  45.7
 87   7.91  52.8  2.9  11.9   79.5  477  2  3  349  188  65.7
 88  10.39  54.6  4.3  14.0   88.3  353  2  2  223  200  65.7
 89   9.36  54.1  4.8  18.3   90.6  165  2  1  127  158  45.7
 90  11.41  50.4  5.8  23.8   73.0  424  1  3  359  335  45.7
 91   8.86  51.3  2.9   9.5   87.5  100  2  3   65   53  25.7
 92   8.93  56.0  2.0   6.2   72.5   95  2  3   59   56  25.7
 93   8.92  53.9  1.3   2.2   79.5   56  2  2   40   14   5.7
 94   8.15  54.9  5.3  12.3   79.8   99  2  4   55   71  25.7
 95   9.77  50.2  5.3  15.7   89.7  154  2  2  123  148  25.7
 96   8.54  56.1  2.5  27.0   82.5   98  2  1   57   75  45.7
 97   8.66  52.8  3.8   6.8   69.5  246  2  3  178  177  45.7
 98  12.01  52.8  4.8  10.8   96.9  298  2  1  237  115  45.7
 99   7.95  51.8  2.3   4.6   54.9  163  2  3  128   93  42.9
100  10.15  51.9  6.2  16.4   59.2  568  1  3  452  371  62.9
101   9.76  53.2  2.6   6.9   80.1   64  2  4   47   55  22.9
102   9.89  45.2  4.3  11.8  108.7  190  2  1  141  112  42.9
103   7.14  57.6  2.7  13.1   92.6   92  2  4   40   50  22.9
104  13.95  65.9  6.6  15.6  133.5  356  2  1  308  182  62.9
105   9.44  52.5  4.5  10.9   58.5  297  2  3  230  263  42.9
106  10.80  63.9  2.9   1.6   57.4  130  2  3   69   62  22.9
107   7.14  51.7  1.4   4.1   45.7  115  2  3   90   19  22.9
108   8.02  55.0  2.1   3.8   46.5   91  2  2   44   32  22.9
109  11.80  53.8  5.7   9.1  116.9  571  1  2  441  469  62.9
110   9.50  49.3  5.8  42.0   70.9   98  2  3   68   46  22.9
111   7.70  56.9  4.4  12.2   67.9  129  2  4   85  136  62.9
112  17.94  56.2  5.9  26.4   91.8  835  1  1  791  407  62.9
113   9.41  59.5  3.1  20.6   91.7   29  2  3   20   22  22.9
;
run;
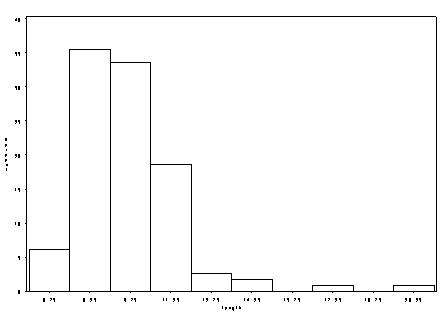
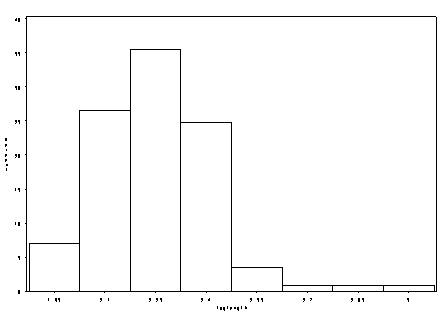
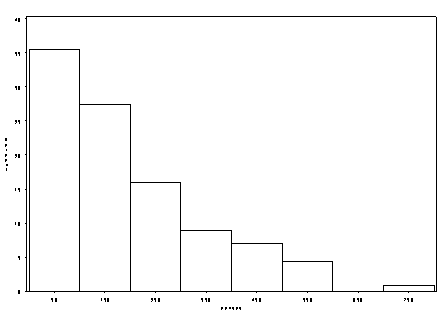
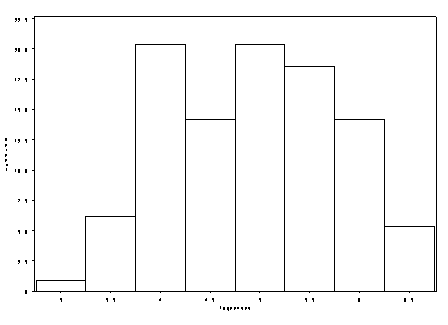
We’ll start of by looking at histograms of the length and census variable in its original metric and log-transformed state.
data senic;
set senic;
loglength = log(length);
logcensus = log(census);
run;
proc univariate data = senic ; var length loglength census logcensus; histogram; run;
[univariate statistics omitted]
In both graphs, we saw how taking a log-transformation of the variable brought the outlying data points from the right tail towards the rest of the data. We’ll start off by interpreting a linear regression model where the variables are in their original metric and then proceed to include the variables in their transformed state.
Variables in their original metric
For the first model with the variables in their original state, we’ll regress average length of stay on the average daily number of patients in the hospital. The interpretation of the relationship is that a one person increase in the average daily number of patients in the hospital will change the average length of stay by 0.006 day.
proc reg data = senic;
model length = census;
run;
The REG Procedure Model: MODEL1 Dependent Variable: lengthAnalysis of Variance Sum of Mean Source DF Squares Square F Value Pr > F Model 1 91.89534 91.89534 32.15 <.0001 Error 111 317.31504 2.85869 Corrected Total 112 409.21038 Root MSE 1.69077 R-Square 0.2246 Dependent Mean 9.64832 Adj R-Sq 0.2176 Coeff Var 17.52396 Parameter Estimates Parameter Standard Variable DF Estimate Error t Value Pr > |t| Intercept 1 8.52093 0.25463 33.46 <.0001 census 1 0.00589 0.00104 5.67 <.0001
Dependent variable transformed
In this model, the dependent variable is in its log-transformed state, and the independent variable is in its original metric. Comparing the coefficient for census to that obtained in the prior model, we note that there is a big difference in coefficients; however, we must recall the scale of the dependent variable changed states. In such models where the dependent variable has been log-transformed and the predictors have not. To interpet the amount of change in the original metric of the outcome, we first exponentiate the coefficient of census to obtain exp(0.00055773)=1.000558. To calculate the percent change, we can subtract one from this number and multiply by 100. Thus, for a one unit increase in the average daily number of patients (census), the average length of stay (length) increases by 0.06 percent.
proc reg data = senic;
model loglength = census;
run;
The REG Procedure Model: MODEL1 Dependent Variable: loglength Analysis of Variance Sum of Mean Source DF Squares Square F Value Pr > F Model 1 0.82367 0.82367 33.57 <.0001 Error 111 2.72379 0.02454 Corrected Total 112 3.54745 Root MSE 0.15665 R-Square 0.2322 Dependent Mean 2.25012 Adj R-Sq 0.2253 Coeff Var 6.96177 Parameter Estimates Parameter Standard Variable DF Estimate Error t Value Pr > |t| Intercept 1 2.14339 0.02359 90.85 <.0001 census 1 0.00055773 0.00009627 5.79 <.0001
Independent variable transformed
In this model we are going to have the dependent variable in its original metric and the independent variable log-transformed. A comparison to the prior two models reveals that the regression coefficient is drastically different. Similar to the prior example the interpretation has a nice format, a one percent increase in the independent variable increases (or decreases) the dependent variable by (coefficient/100) units. In this particular model we’d say that a one percent increase in the average daily number of patients in the hospital would result in a (1.155/100) = 0.012 day increase in the average length of stay.
proc reg data = senic;
model length = logcensus;
run;
The REG Procedure Model: MODEL1 Dependent Variable: length Analysis of Variance Sum of Mean Source DF Squares Square F Value Pr > F Model 1 97.87500 97.87500 34.90 <.0001 Error 111 311.33538 2.80482 Corrected Total 112 409.21038 Root MSE 1.67476 R-Square 0.2392 Dependent Mean 9.64832 Adj R-Sq 0.2323 Coeff Var 17.35806 Parameter Estimates Parameter Standard Variable DF Estimate Error t Value Pr > |t| Intercept 1 3.93711 0.97957 4.02 0.0001 logcensus 1 1.15513 0.19554 5.91 <.0001
Both dependent and independent variables transformed
In instances where both the dependent variable and independent variable(s) are log-transformed variables, the relationship is commonly referred to as elastic in econometrics. In a regression setting, we’d interpret the elasticity as the percent change in y (the dependent variable), while x (the independent variable) increases by one percent. For this model we’d conclude that a one percent increase in the average daily number of patients in the hospital would yield a 0.11% increase in the average length of stay.
proc reg data = senic;
model loglength = logcensus;
run;
The REG Procedure Model: MODEL1 Dependent Variable: loglength Analysis of Variance Sum of Mean Source DF Squares Square F Value Pr > F Model 1 0.94180 0.94180 40.12 <.0001 Error 111 2.60566 0.02347 Corrected Total 112 3.54745 Root MSE 0.15321 R-Square 0.2655 Dependent Mean 2.25012 Adj R-Sq 0.2589 Coeff Var 6.80912 Parameter Estimates Parameter Standard Variable DF Estimate Error t Value Pr > |t| Intercept 1 1.68988 0.08961 18.86 <.0001 logcensus 1 0.11331 0.01789 6.33 <.0001


