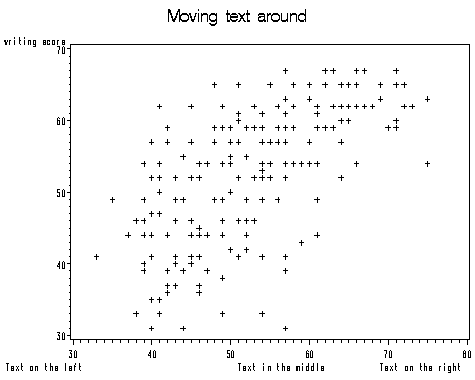
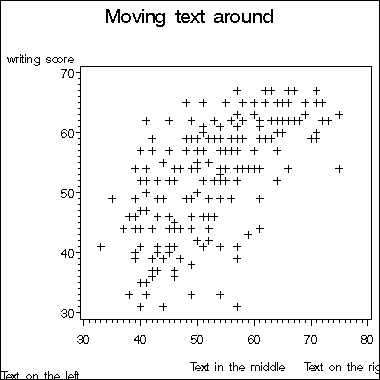
Sometimes part of the text on a plot may be too far from the plot or too close. You can use the move option to move the text around. Below is an example using the hsb2.sas7bdat data set. Text can be moved around on the graph using the note statement in proc gplot. To indicate to SAS where the text should be moved, you need to specify the x and y coordinates. Imagine that the entire graph area (including title, axis labels, etc.) is a grid, with coordinate (0,0) in the lower left corner. Each time you want to indicate a new location to place text, you need to specify the (x,y) coordinates. In addition to specifying the coordinates, you need to select the measurement system used to define the coordinates. The coordinates can be measured as a percent of the entire graph area, in inches, in centimeters, or in cells. Cells are the default and will be used unless you specify otherwise. In our example below, we will use percent, abbreviated pct. The move = option (which can be shortened to m = ) indicates where we want the text given on that note statement to start. For the first note, we used m = (1pct, 2.5 pct), indicating that we want the text to start at 2.5 percent above the "invisible" border and 1 percent to the right of the "invisible" border of the entire graphing area. If we were to use (0pt, 0pt), then the text will be at the most of the lower left corner as shown below. Note that we used the axis1 statement to suppress the label on the horizontal axis.
goptions reset = all;
axis1 label=(" ");
proc gplot data = hsb2;
  title "Moving text around";
  plot write*math /haxis=axis1;
  note m=(1pct,2.5pct) "Text on the left";
  note m=(50pct,2.5pct) "Text in the middle";
  note m=(80pct,2.5pct) "Text on the right";
run;
quit;
proc gplot data = ats.hsb2;
  title "Moving text around";
  plot write*math /haxis=axis1;
  note m=(0pct,0pct) "Text on the left";
  note m=(50pct,2.5pct) "Text in the middle";
  note m=(80pct,2.5pct) "Text on the right";
run;
quit;


