
When looking at distributions of variables, you may be interested in looking at the distributions of groups within your data.
This page demonstrates how to overlay density plots of variables in your data by
groups. To do this, we will use proc sgplot. The data used on this
page is the hsb2 dataset. This data
contains a 3-level categorical variable, ses, and we will create
histograms and densities for each level.
The code below creates overlaid
histograms. These represent the distributions of the read and write variables
within the indicated ses level. We have set the "transparency" of the overlay to
.5 so that we can see the bars underneath. With proc sgpanel, we must
indicate a panelby variable and the dataset must be sorted on this
variable.
proc sort data = hsb2;
  by ses;
run;

proc sgpanel data=hsb2;
  panelby ses;
  colaxis label = "Score";
  histogram read / legendlabel = "Read";
  histogram write / transparency = .5 legendlabel = "Write";
run;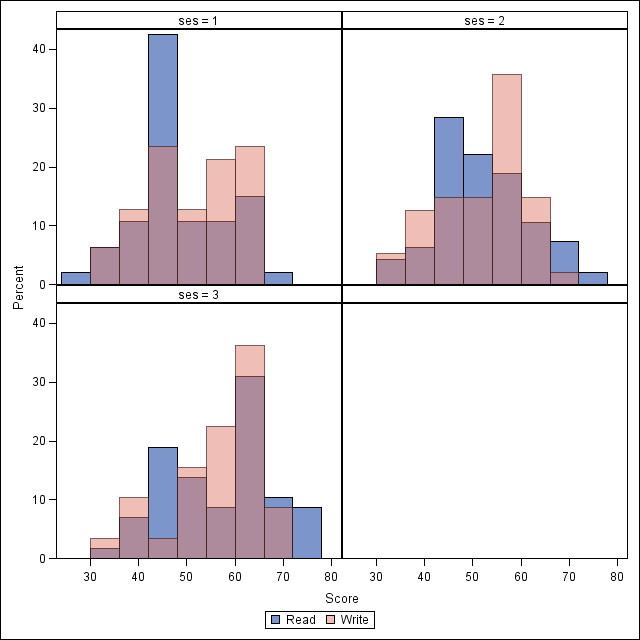
This looks okay, but it would probably be easier to interpret a smooth density plot.
proc sgpanel data=hsb2;
  panelby ses;
  colaxis label = "Score";
  density read / legendlabel = "Read";
  density write / legendlabel = "Write";
run;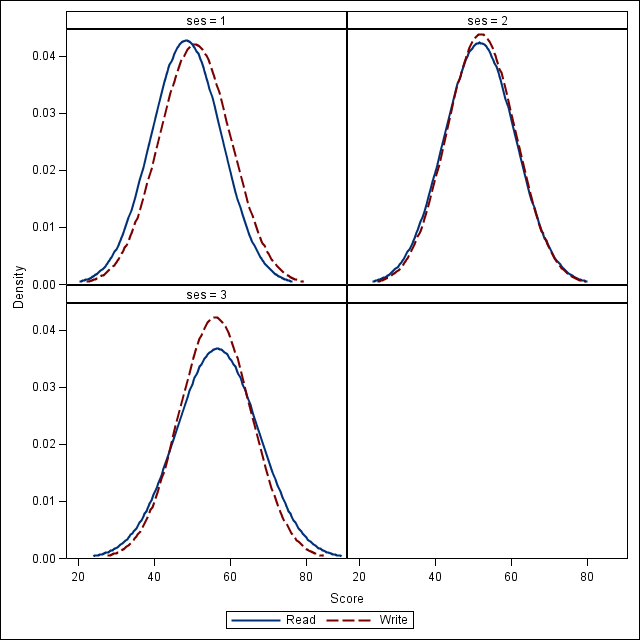
We have seen how to create overlays of one variable on another. What if we are interested in a single variable, but separated by another group
in our data? For example, we want to compare the distributions of write
within each level of ses for males and females. We can use very similar
proc sgpanel code after a little bit of data management.
data hsb3; set hsb2;
  wfemale = .;
  wmale = .;
  if female = 1 then wfemale = write;
  if female = 0 then wmale = write;
  keep ses wfemale wmale;
run;
Now our dataset represents write in two variables: wfemale and
wmale.
proc sgpanel data=hsb3;
  panelby ses;
  colaxis label = "Writing Score";
  density wmale / LEGENDLABEL= "Male";
  density wfemale / LEGENDLABEL= "Female";
run;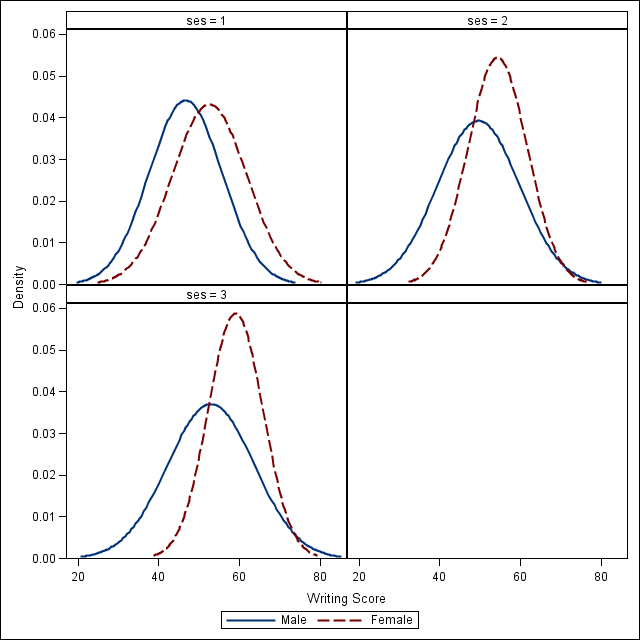
Proc sgpanel is a very nice tool for exploring data by groups. Further examples can be found in the online SAS support
and in the paper SGPANEL: Telling the Story Better
by Chuck Kincaid.