SAS output is rarely the form in which results are presented. Many create results tables in Excel. This page will provide an example of how to send data or results generated in SAS to specific cell locations in an Excel worksheet. We will be using the Dynamic Data Exchange (DDE) method in SAS to do so. DDE allows you to move information from SAS to Windows applications. We can start with a small example. We can open a new Excel sheet and send three variable names to the first row and then generate three variables to put in the cells below the names.
To open a new Excel sheet from SAS, we use the x command followed by the path to Excel program folder containing the .exe file. We have indicated noxwait and noxsync. The first allows you to use the x command, which opens outside programs, without typing "exit" before returning to SAS. The second turns off the normal buffering initiated with the X Window System.
options noxwait noxsync;
x '"C:Program FilesMicrosoft OfficeOFFICE11excel.exe"';
Running the above two lines (with the appropriate pathname to Excel) will open a blank Excel spreadsheet. Next, we will indicate with a filename the sheet and cells of the open sheet that we will write to from SAS.
filename example1 dde 'excel|sheet1!r1c1:r1c3';
Above, we are creating a filename example1 that will write to the sheet and cells indicated–sheet1 (the default name of a new Excel file), from the first cell in the first row ("r1c1") to the third cell in the first row ("r1c3"). Next, we can run the data step below. It includes a file statement referring to the specified location in the open Excel file. We create three variables, x, y and z, with one value each. Then we put the three variables into Excel.
data _null_;
  file example1;
  x = "x";
  y = "y";
  z = "z";
  put x y z;
run;
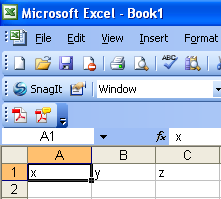
We can see that these character values have been put into the first three cells of the first row in Excel.
Next, we can indicate the next block of cells that we wish to write to.
filename example1 dde 'excel|sheet1!r2c1:r101c3';
We will create a variable with 100 values drawn with the ranuni function, and then create two more variables based on that variable. We will again use file and put statements.
data _null_;
   file example1;
   do i=1 to 100;
      x=ranuni(i);
      y=10+x;
      z=x-10;
      put x y z;
   end;
run;
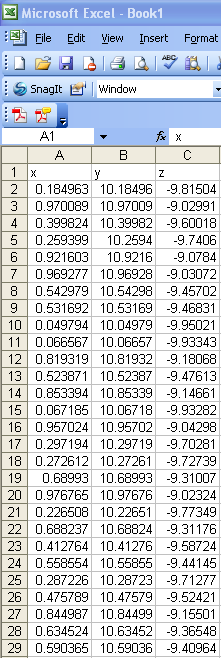
We can see that the Excel sheet now contains these values.
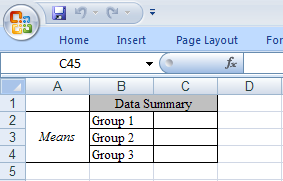
This use of DDE can be very useful if you have multiple data sets for which you want to do the same analysis and present results in a consistent template in Excel. We created a small results template in Excel for presenting the means of three groups in a dataset. The mean values have been left blank and we saved the spreadsheet as DDE_template.xls and named the template sheet means.
Next, we can look at an example dataset with three groups and use proc means to calculate the group means.
data d1;
  input group score;
  cards;
1	7.960000038
1	7.590000153
1	7.849999905
1	8
1	7.75
2	8.050000191
2	8.069999695
2	7.78000021
2	7.619999886
2	8.170000076
3	8.090000153
3	8.229999542
3	8
3	8.090000153
3	7.880000114
;

proc sort data = d1;
  by group;
run;

proc means noprint data = d1;
  by group;
  var score;
  output out = d1_means;
run;
Now, we can open our template spreadsheet and use a filename statement to indicate the three empty cells in our template.
options noxwait noxsync;
x '"D:DataDDE_template.xls"';
filename example2 dde 'excel|means!r2c3:r4c3';
This will open the our template file. Next, we can use file and put statements for the three statistics of interest.
data d1_means; set d1_means;
  file example2;
  if _stat_ = "MEAN" then put score;
run;
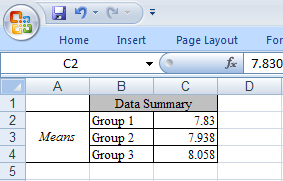
We can now look at our filled-in template. Our results have been formatted according to the formats for the cells to which they are exported.


