Say you run a logistic regression, and you would like to show a graph with
the y axis having the probability of the event and the x axis being your
predictor. The following shows how you can construct such a graph.
Say that you do a logistic regression and the coefficients are
Constant is -3
x1 is.3
x2 is .1
Also, say the mean of X2 is .5
Say that you want to make a graph of the probability of Y by X1 showing X1
from 1 to 30, and hold all other variables constant at their mean (i.e., X2 would
be .5). The following program generates data for X1 from 1 to 30, and
computes the predicted value of Y for these values, and then makes a graph of
the results.
* create a new data file that just has "x1" in it from 1 to 30 by 1.
input program.
loop #i = 1 to 30 by 1.
compute x1 = #i.
end case.
end loop.
end file.
end input program.
execute.* fill in logistic equation below .
* say equation is -3 + .3*x1 + .1 * x2.
* and x2 has a mean of .5.
compute ylog = -3 + .3*x1 + .5*.1 .
compute py = 1-1/(1 + exp(ylog)) .
execute.* show graph with prob y on y axis, and x1 on x axis.
GRAPH /LINE(SIMPLE)=VALUE( py ) BY x1 .
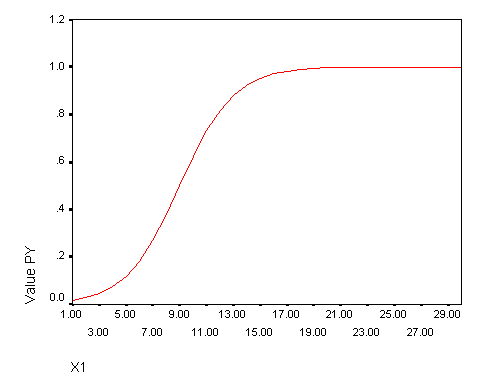
This produces the following graph.
You can make a graph of your own by …
- Change "1 to 30 by 1" to the range of values you want for your
predictor. - Change the "compute ylog =" to have the data from your
regression.
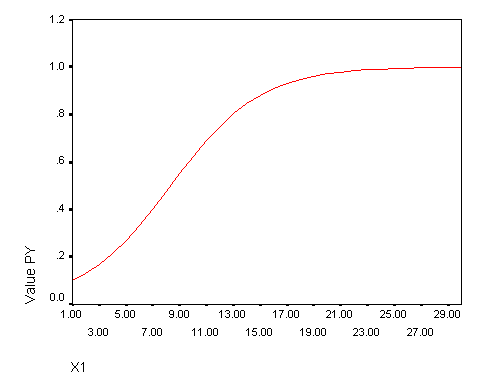
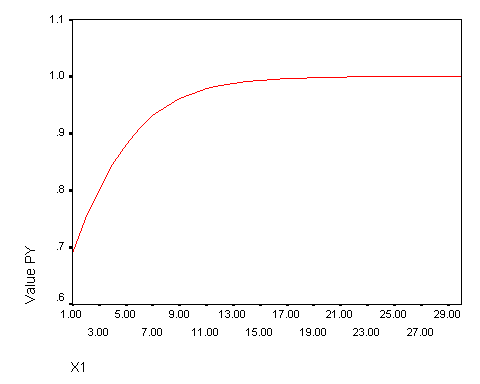
Here are examples where we vary the intercept, using -10 then 5 then 0.
* say equation is -10 + .3*x1 + .1 * x2 (x2 has a mean of 5).

compute ylog = -10 + .3*x1 + 5*.1  .

compute py = 1 – 1/(1 + exp(ylog)) .

execute.

GRAPH /LINE(SIMPLE)=VALUE( py ) BY x1 .
compute ylog = -5 + .3*x1 + 5*.1  .

compute py = 1-1/(1 + exp(ylog)) .

execute.

GRAPH /LINE(SIMPLE)=VALUE( py ) BY x1 .
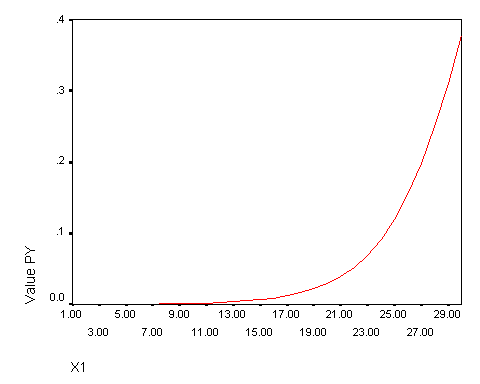
compute ylog = 0 + .3*x1 + 5*.1  .

compute py = 1-1/(1 + exp(ylog)) .

execute.

GRAPH /LINE(SIMPLE)=VALUE( py ) BY x1 .
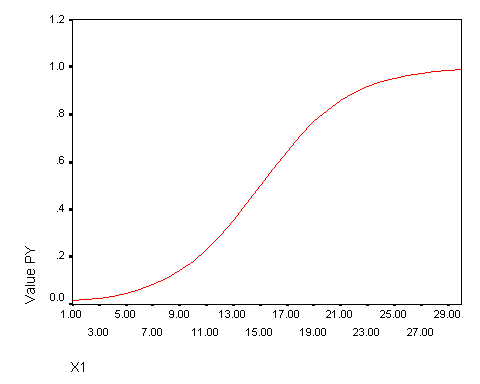
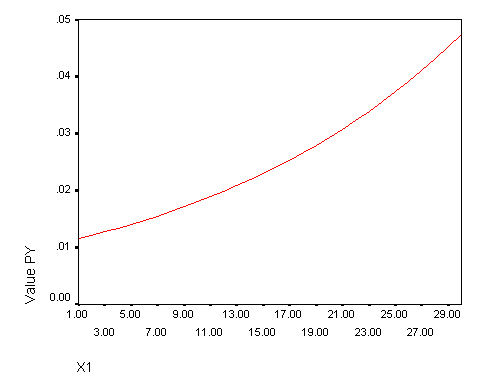
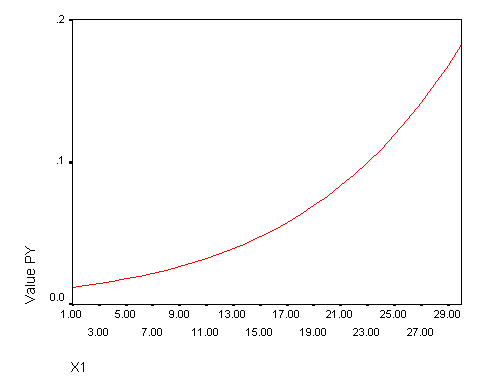
Here are examples showing how the graphs change when the coefficient changes
from .05 to .1 to .3 to .5.
compute ylog = -5 + .05*x1 + 5*.1  .

compute py = 1-1/(1 + exp(ylog)) .

GRAPH /LINE(SIMPLE)=VALUE( py ) BY x1 .
compute ylog = -5 + .1*x1 + 5*.1  .

compute py = 1-1/(1 + exp(ylog)) .

GRAPH /LINE(SIMPLE)=VALUE( py ) BY x1 .
compute ylog = -5 + .3*x1 + 5*.1  .

compute py = 1-1/(1 + exp(ylog)) .

GRAPH /LINE(SIMPLE)=VALUE( py ) BY x1 .
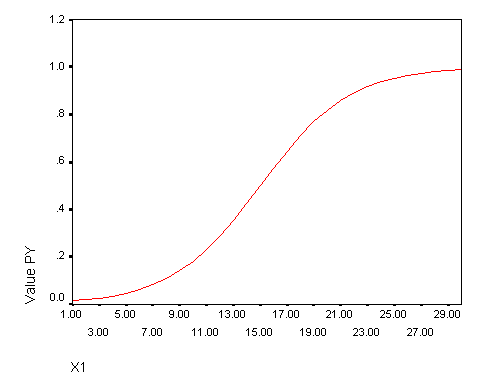
compute ylog = -5 + .5*x1 + 5*.1  .

compute py = 1-1/(1 + exp(ylog)) .

GRAPH /LINE(SIMPLE)=VALUE( py ) BY x1 .