Linear regression, also called OLS (ordinary least squares) regression, is used to model continuous outcome variables. In the OLS regression model, the outcome is modeled as a linear combination of the predictor variables.
Please note: The purpose of this page is to show how to use various data analysis commands. It does not cover all aspects of the research process which researchers are expected to do. In particular, it does not cover data cleaning and checking, verification of assumptions, model diagnostics and potential follow-up analyses.
Examples of linear regression
Example 1: A researcher is interested in how scores on a math and a science test are associated with scores on a writing test. The outcome variable is the score on the writing test.
Example 2: A research team is interested in motivating people to eat more vegetables by showing subjects videos of simple ways to prepare vegetables for dinner. The outcome variable is the number of ounces of vegetables consumed for dinner for one week.
Example 3: Researchers are interested in the effect of light on sleep quality. They randomly assign subjects to different light conditions and measure sleep quality for one month. The average seep quality score is the outcome variable.
Description of the data
For our data analysis below, we are going to expand on Example 1 about the association between test scores. We have generated hypothetical data, hsb2, which can be obtained from our website.
get file "D:\data\hsb2.sav".
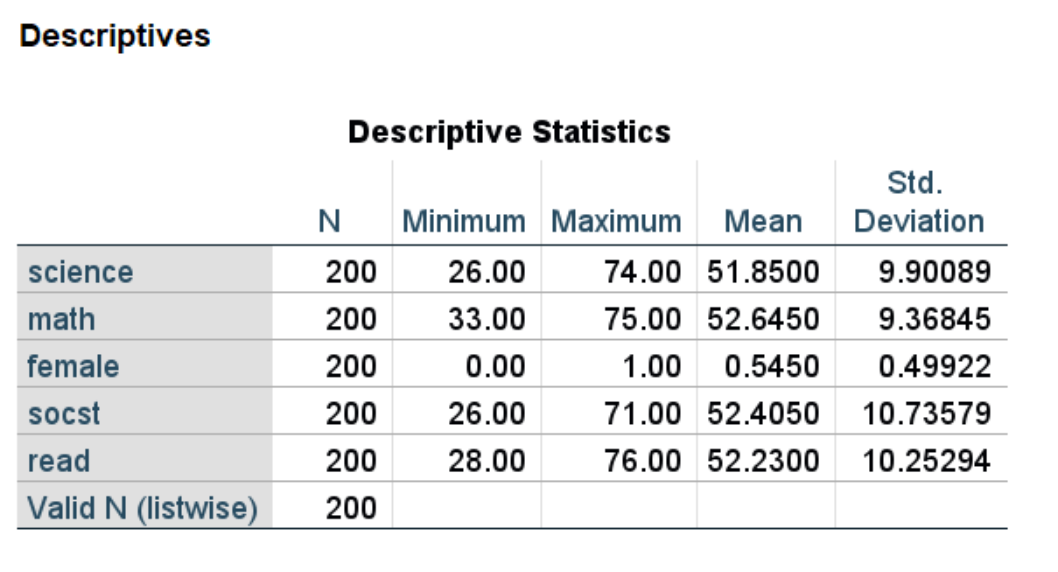
We can obtain descriptive statistics for each of the variables that we will use in our linear regression model. Although the variable female is binary (coded 0 and 1), we can still use it in the descriptives command.
descriptives variables = science math female socst read.
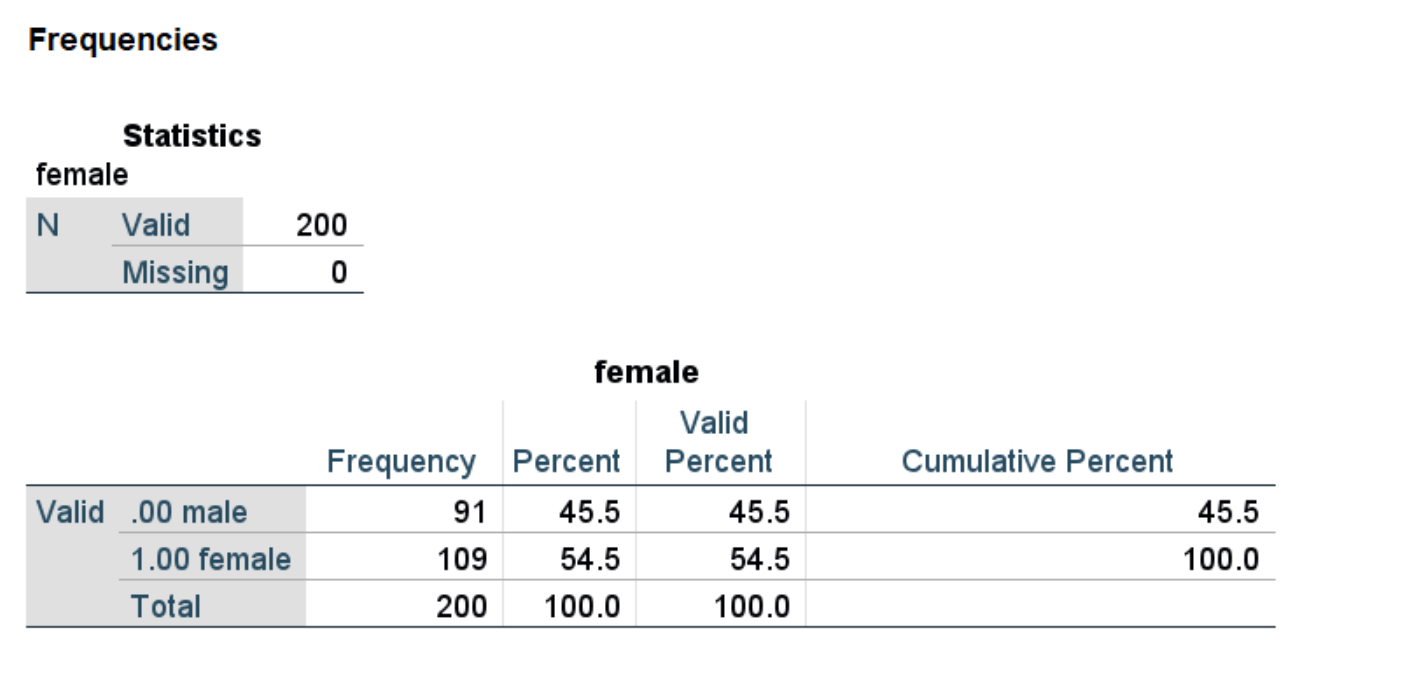
We can use the frequencies command to see the numbers of males and females.
frequencies variables = female.
Analysis methods you might consider
Below is a list of some analysis methods you may have encountered.
-
- Linear regression, the focus of this page.
- ANCOVA: ANCOVA will give the same results as linear regression, except with a different parameterization. Linear regression will use dummy coding for categorical predictors, while ANCOVA will use effect coding.
- Robust regression: Robust regression is a type of linear regression used when the assumption of homogeneity of variance may be violated.
Linear regression
Below we use the regression command to estimate a linear regression model.
regression
    /dep = science
    /method = enter math female socst read.
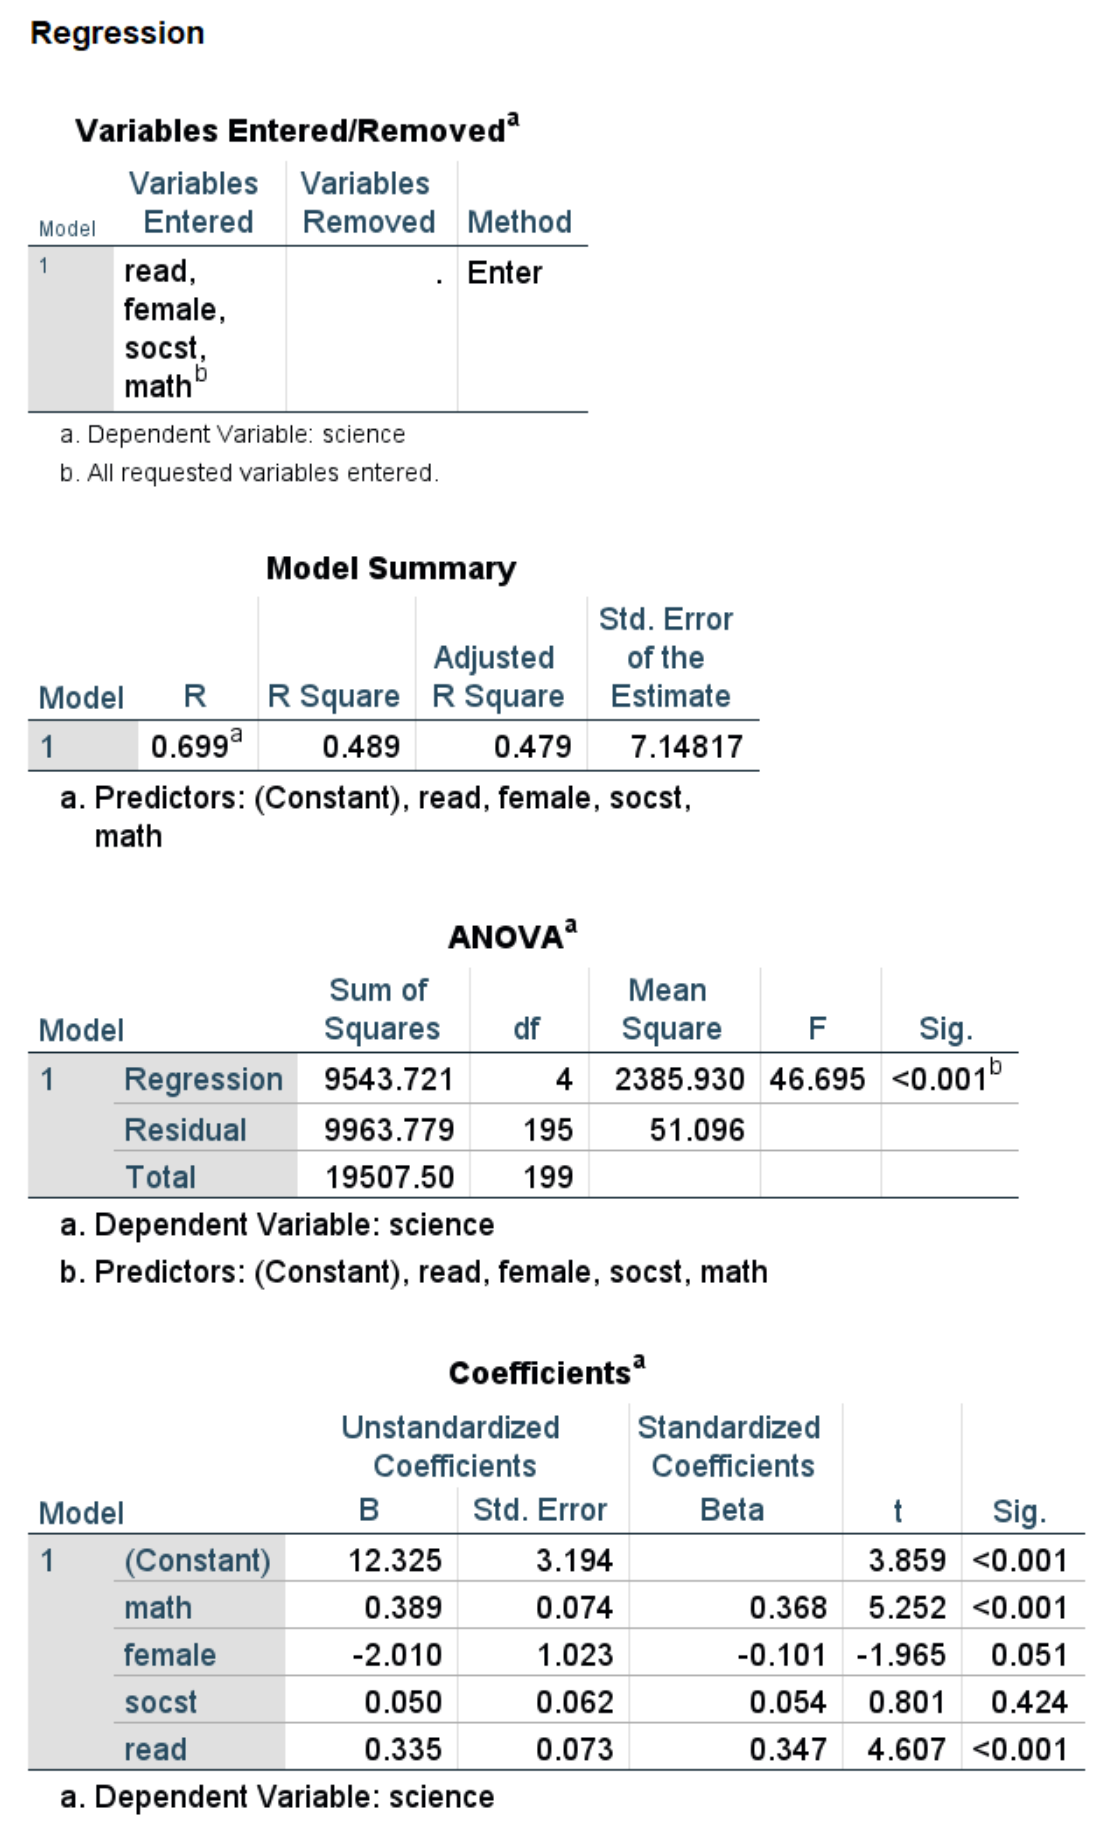
- In the Model Summary table, we see the R-squared value of 0.489, which indicates the proportion of variance in the outcome accounted for by the model.
- We also see the adjusted R-squared value of 0.479, which adjusts the R-squared value for the number and quality of the predictors.
- In the ANOVA table, we can see that the overall model is statistically significant (p < 0.001).
- In the Coefficients table, we see the coefficients, their standard errors, the standardized coefficients, the t-statistic and associated p-values. Both math and read are statistically
significant.
- For every one unit change in math, the expected value of science increases by 0.389.
- For a one unit increase in read, the expected value of science increases by 0.335.
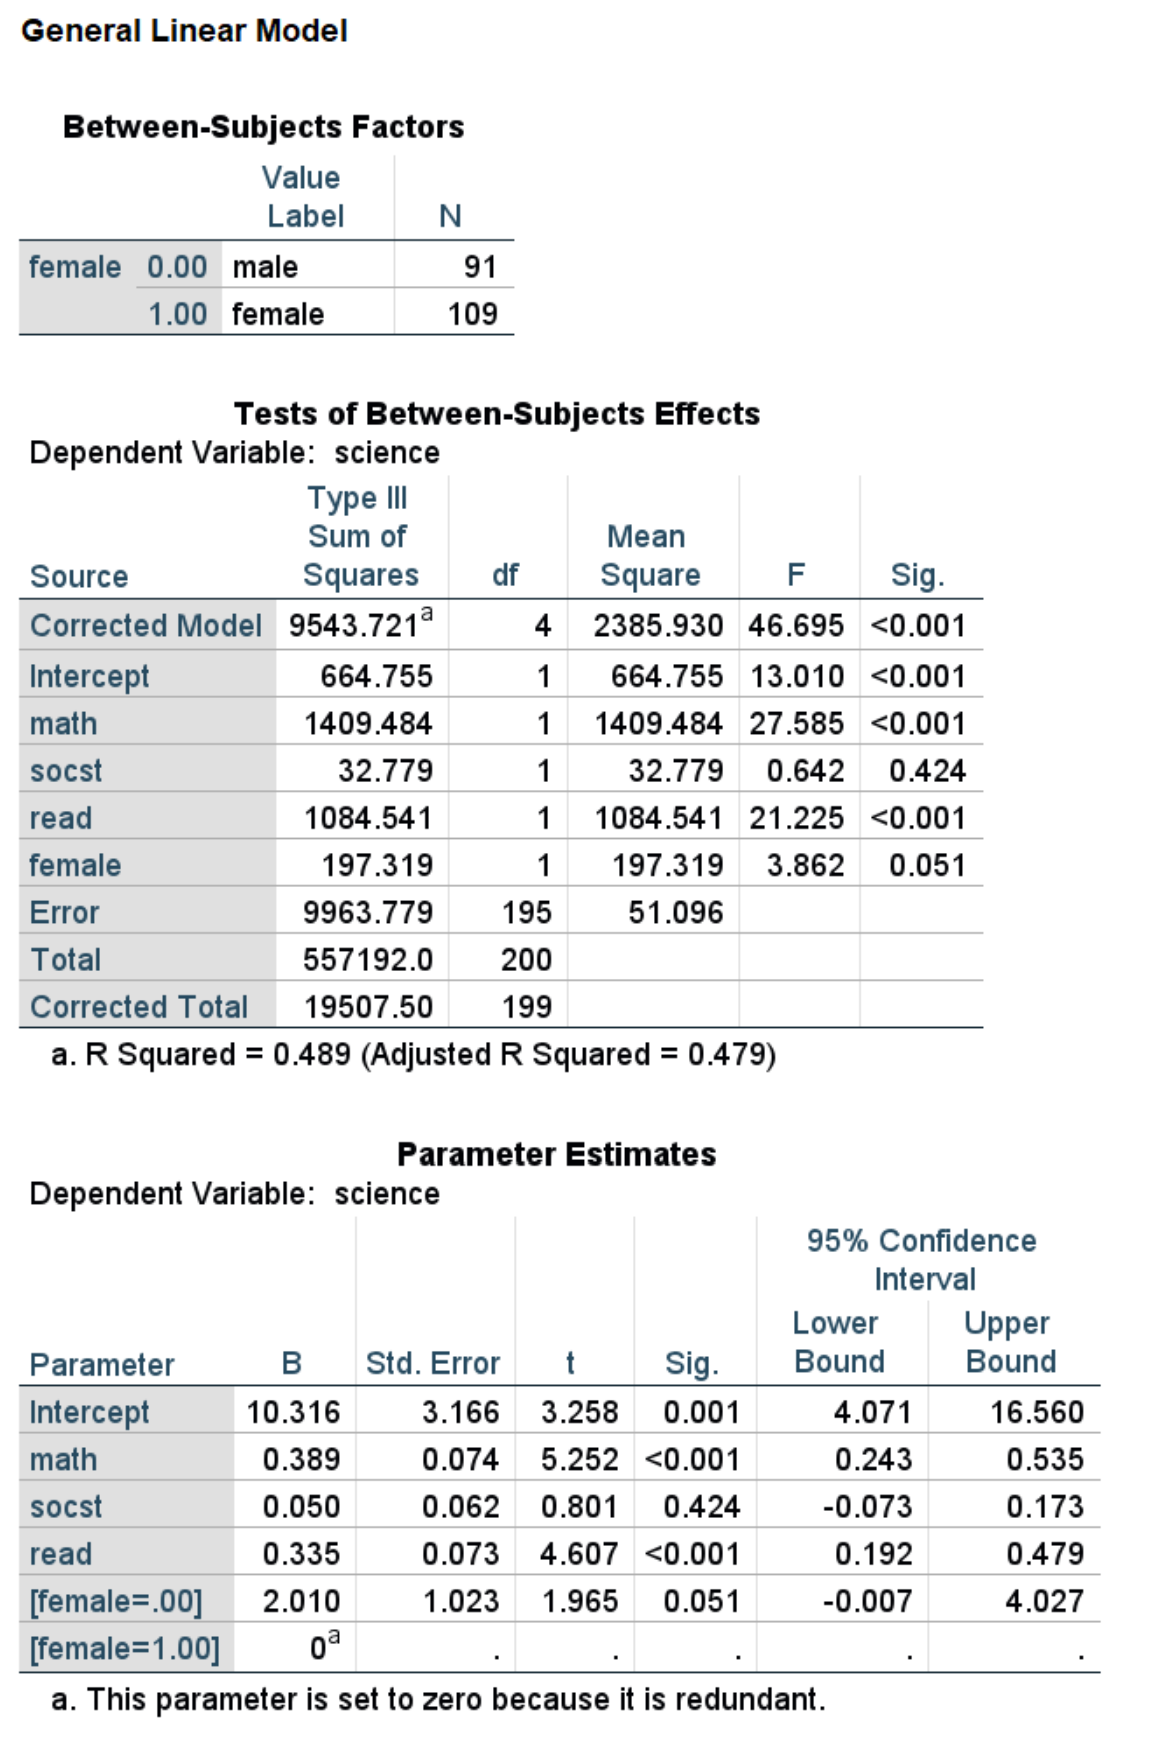
We could have also used the glm command. If you have categorical predictors, the glm command may be easier to use because you can use the SPSS keyword by in the glm command to have SPSS create the dummy variables for you. If you use the regression command, you need to create the dummy variables before running the regression command. When using the glm command, you will want to include the print subcommand with the parameter option so that the table of regression coefficients is included in the output. By default, the SPSS keyword by uses the highest-numbered category as the reference group. Hence, in the output below, the coefficient for the variable female has the opposite sign from that show in the regression output: in the glm output, the category coded 1 (i.e., females) is the reference group, and in the regression output, the category coded 0 (i.e., males) is the reference group. The difference in reference groups is also the reason why the constants are different.
glm science with math socst read by female
    /print = parameter.
Things to consider
- The outcome variable in a linear regression is assumed to be continuous. It should have a reasonable range of values. There is no assumption that the distribution of the outcome is normal.
- The assumptions of linear regression should be checked. Please see SPSS Web Book: Linear Regression for information on the assumptions of linear regression and how to assess these assumptions in SPSS.
- Clustered data: Sometimes observations are clustered into groups (e.g., people within families, students within classrooms). In such cases, you may want to see our page on non-independence within clusters.
References
- Regression with Graphics: A Second Course in Statistics by Lawrence C. Hamilton
- Regression Analysis: A Constructive Critique by Richard A. Berk
See also
- Stata Annotated Output: Linear regression
- Stata Web Book: Linear regression