
Version info: Code for this page was tested in IBM SPSS 20.
MANOVA is used to model two or more dependent variables that are
continuous with one or more categorical predictor variables.
Please note: The purpose of this page is to show how to use various data
analysis commands. It does not cover all aspects of the research process which
researchers are expected to do. In particular, it does not cover data
cleaning and checking, verification of assumptions, model diagnostics or
potential follow-up analyses.
Examples of one-way multivariate analysis of variance
Example 1.
A researcher randomly assigns 33 subjects to one of three groups. The first group
receives technical dietary information interactively from an on-line website. Group
2 receives the same information from a nurse practitioner, while group 3 receives the
information from a video tape made by the same nurse practitioner. The
researcher looks
at three different ratings of the presentation, difficulty, usefulness and importance, to determine
if there is a difference in the modes of presentation. In particular, the researcher is
interested in whether the interactive website is superior because that is the most cost-effective
way of delivering the information.
Example 2. A clinical psychologist recruits 100 people who suffer from
panic disorder into his study. Each subject receives one of four types of
treatment for eight weeks. At the end of treatment, each subject
participates in a structured interview, during which the clinical psychologist
makes three ratings: physiological, emotional and cognitive. The
clinical psychologist wants to know which type of treatment most reduces the
symptoms of the panic disorder as measured on the physiological, emotional and
cognitive scales. (This example was adapted from Grimm and Yarnold, 1995,
page 246.)
Description of the data
Let’s pursue Example 1 from above.
We have a data file, manova.sav, with 33 observations on three response
variables. The response variables are ratings called useful, difficulty and importance. Level 1 of the group variable is the treatment group, level 2 is control group 1 and
level 3 is control group 2.
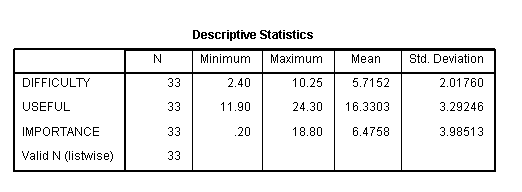
Let’s look at the data. It is always a good idea to start with descriptive
statistics.
get file='d:\data\manova.sav' .

descriptives
 variables=difficulty useful importance.
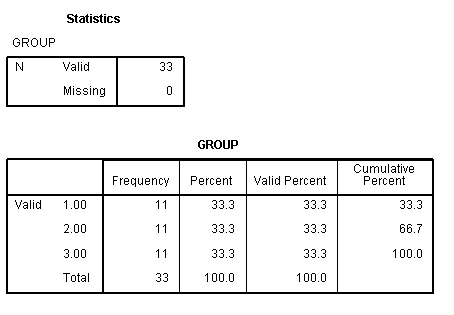
frequencies
 variables=group.
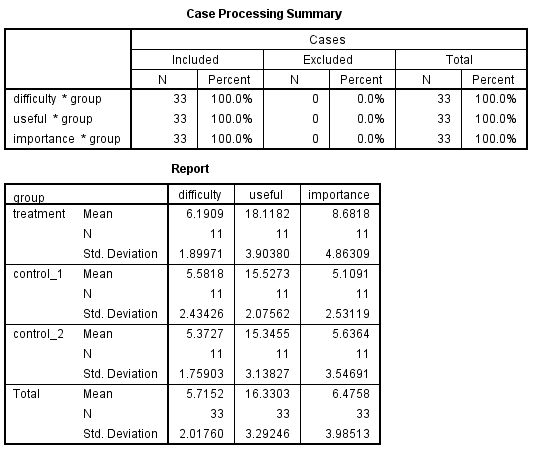
means tables=difficulty useful importance by group.
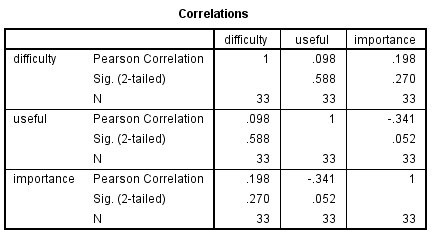
correlations variables=difficulty useful importance.
Analysis methods you might consider
Below is a list of some analysis methods you may have
encountered. Some of the methods listed are quite reasonable, while others
have either fallen out of favor or have limitations.
- MANOVA – This is a good option if there are two or more continuous
dependent variables and one categorical predictor variable. - Discriminant function analysis – This is a reasonable option and is equivalent to
a one-way MANOVA. - The data could be reshaped into long format and analyzed as a multilevel
model. - Separate univariate ANOVAs – You could analyze these data using separate univariate
ANOVAs for each response variable. The univariate ANOVA
will not produce multivariate results utilizing information from all variables
simultaneously. In addition, separate univariate tests are generally less powerful
because they do not take into account the inter-correlation of the dependent
variables.
One-way MANOVA
We will start by running the manova command. After the
categorical predictor variable group, we need to specify the minimum and
maximum values of that variable in parentheses.
manova difficulty useful importance by group(1,3).
  - - - - - - - - - - - - - - - - - - - - - - - - - - - - - - - - - - - - - - - - - - - - - - - - - - - - - - - - - - - -
The default error term in MANOVA has been changed from WITHIN CELLS to
WITHIN+RESIDUAL.  Note that these are the same for all full factorial designs.

* * * * * * * * * * * * * * * * * A n a l y s i s   o f   V a r i a n c e * * * * * * * * * * * * * * * * *


        33 cases accepted.
         0 cases rejected because of out-of-range factor values.
         0 cases rejected because of missing data.
         3 non-empty cells.

         1 design will be processed.

 - - - - - - - - - - - - - - - - - - - - - - - - - - - - - - - - - - - - - - - - - - - - - - - - - - - - - - - - - - - -

* * * * * * * * * * * * * * * * * A n a l y s i s   o f   V a r i a n c e -- Design   1 * * * * * * * * * * * * * * * * *

 EFFECT .. GROUP
 Multivariate Tests of Significance (S = 2, M = 0, N = 13 )

 Test Name             Value        Approx. F       Hypoth. DF         Error DF        Sig. of F

 Pillais                .47667          3.02483             6.00            58.00             .012
 Hotellings             .89723          4.03753             6.00            54.00             .002
 Wilks                  .52579          3.53823             6.00            56.00             .005
 Roys                   .47146
 Note.. F statistic for WILKS' Lambda is exact.

 - - - - - - - - - - - - - - - - - - - - - - - - - - - - - - - - - - - - - - - - - - - - - - - - - - - - - - - - - - - -
 EFFECT .. GROUP (Cont.)
 Univariate F-tests with (2,30) D. F.

 Variable         Hypoth. SS         Error SS       Hypoth. MS         Error MS                F        Sig. of F

 DIFFICUL            3.97515        126.28728          1.98758          4.20958           .47216             .628
 USEFUL             52.92424        293.96544         26.46212          9.79885          2.70053             .083
 IMPORTAN           81.82969        426.37090         40.91485         14.21236          2.87882             .072

 - - - - - - - - - - - - - - - - - - - - - - - - - - - - - - - - - - - - - - - - - - - - - - - - - - - - - - - - - - - -

Abbreviated  Extended
Name         Name

DIFFICUL     DIFFICULTY
IMPORTAN     IMPORTANCE
- At the top of the output, we can see that all 33 cases in our dataset
are used in the analysis. - Next we see a table of the multivariate tests. All of the tests of
the overall model are statistically significant. For more information
on the various multivariate tests, please see our
Annotated Output: SPSS MANOVA. - In the third part of the output, we see the tests of the individual
outcome variables. Individually, none of the outcome variables is
statistically significant at the .05 level of alpha. - Finally, we see legend showing us how SPSS abbreviated the names of some
of the outcome variables.
We will begin by comparing the treatment group (group 1) to an average of the
control groups (groups 2 and 3). This tests the hypothesis that the mean
of the control groups equals the treatment group. We will also compare control
group 1 (group 2) to control group 2 (group 3). The first hypothesis is
given on the second line of the contrast subcommand, and the second
hypothesis is given on the third line of the contrast subcommand.
manova difficulty useful importance by group(1,3)
/contrast(group) = special (1  1  1
                            2 -1 -1
                            0  1 -1)
/design = group(1) group(2).
< some output omitted > * * * * * * * * * * * * * * * * * A n a l y s i s o f V a r i a n c e -- Design 1 * * * * * * * * * * * * * * * * * EFFECT .. GROUP(1) Multivariate Tests of Significance (S = 1, M = 1/2, N = 13 ) Test Name Value Exact F Hypoth. DF Error DF Sig. of F Pillais .47101 8.31034 3.00 28.00 .000 Hotellings .89039 8.31034 3.00 28.00 .000 Wilks .52899 8.31034 3.00 28.00 .000 Roys .47101 Note.. F statistics are exact. - - - - - - - - - - - - - - - - - - - - - - - - - - - - - - - - - - - - - - - - - - - - - - - - - - - - - - - - - - - - EFFECT .. GROUP(1) (Cont.) Univariate F-tests with (1,30) D. F. Variable Hypoth. SS Error SS Hypoth. MS Error MS F Sig. of F DIFFICUL 3.73470 126.28728 3.73470 4.20958 .88719 .354 USEFUL 52.74242 293.96544 52.74242 9.79885 5.38251 .027 IMPORTAN 80.30060 426.37090 80.30060 14.21236 5.65005 .024 < some output omitted >
- These results indicate that group 1 is statistically significantly different
from the average of groups 2 and 3.
< some output omitted >* * * * * * * * * * * * * * * * * A n a l y s i s o f V a r i a n c e -- Design 1 * * * * * * * * * * * * * * * * * EFFECT .. GROUP(2) Multivariate Tests of Significance (S = 1, M = 1/2, N = 13 ) Test Name Value Exact F Hypoth. DF Error DF Sig. of F Pillais .00679 .06381 3.00 28.00 .979 Hotellings .00684 .06381 3.00 28.00 .979 Wilks .99321 .06381 3.00 28.00 .979 Roys .00679 Note.. F statistics are exact. - - - - - - - - - - - - - - - - - - - - - - - - - - - - - - - - - - - - - - - - - - - - - - - - - - - - - - - - - - - - EFFECT .. GROUP(2) (Cont.) Univariate F-tests with (1,30) D. F. Variable Hypoth. SS Error SS Hypoth. MS Error MS F Sig. of F DIFFICUL .24045 126.28728 .24045 4.20958 .05712 .813 USEFUL .18182 293.96544 .18182 9.79885 .01856 .893 IMPORTAN 1.52909 426.37090 1.52909 14.21236 .10759 .745 - - - - - - - - - - - - - - - - - - - - - - - - - - - - - - - - - - - - - - - - - - - - - - - - - - - - - - - - - - - -< some output omitted >
- The results indicate that control group 1 is not statistically significantly
different from control group 2.
We can use the pmeans subcommand to obtain adjusted predicted values for
each of the groups. In the first table below, we get the predicted means
for the dependent variable difficulty. In the next two tables, we
get the predicted means for the dependent variables useful and
importance. These values can be helpful in seeing where differences
between levels of the predictor variable are and describing the model.
manova difficulty useful importance by group(1,3)
/pmeans.
< some output omitted >- - - - - - - - - - - - - - - - - - - - - - - - - - - - - - - - - - - - - - - - - - - - - - - - - - - - - - - - - - - - Adjusted and Estimated Means Variable .. DIFFICULTY Factor Code Obs. Mean Adj. Mean Est. Mean Raw Resid. Std. Resid. GROUP 1 6.19091 6.19091 6.19091 .00000 .00000 GROUP 2 5.58182 5.58182 5.58182 .00000 .00000 GROUP 3 5.37273 5.37273 5.37273 .00000 .00000 - - - - - - - - - - - - - - - - - - - - - - - - - - - - - - - - - - - - - - - - - - - - - - - - - - - - - - - - - - - - Adjusted and Estimated Means (Cont.) Variable .. USEFUL Factor Code Obs. Mean Adj. Mean Est. Mean Raw Resid. Std. Resid. GROUP 1 18.11818 18.11818 18.11818 .00000 .00000 GROUP 2 15.52727 15.52727 15.52727 .00000 .00000 GROUP 3 15.34545 15.34545 15.34545 .00000 .00000 - - - - - - - - - - - - - - - - - - - - - - - - - - - - - - - - - - - - - - - - - - - - - - - - - - - - - - - - - - - - Adjusted and Estimated Means (Cont.) Variable .. IMPORTANCE Factor Code Obs. Mean Adj. Mean Est. Mean Raw Resid. Std. Resid. GROUP 1 8.68182 8.68182 8.68182 .00000 .00000 GROUP 2 5.10909 5.10909 5.10909 .00000 .00000 GROUP 3 5.63636 5.63636 5.63636 .00000 .00000 - - - - - - - - - - - - - - - - - - - - - - - - - - - - - - - - - - - - - - - - - - - - - - - - - - - - - - - - - - - -< some output omitted >
In each of the three tables above, we see that the predicted means for
groups 2 and 3 are very similar; the predicted mean for group 1 is higher than
those for groups 2 and 3.
In the example below, we obtain the differences in the means for each of the
dependent variables for each of the control groups (groups 2 and 3) compared to
the treatment group (group 1). With respect to the dependent variable
difficulty, the difference between the means for control group 1 versus the
treatment group is approximately -0.61 (5.58 – 6.19). The difference
between the means for control group 2 versus the treatment group is
approximately -0.82 (5.37 – 6.19).
manova difficulty useful importance by group(1,3)
/contrast(group) = special(1 1 1
                           -1 1 0
                           -1 0 1).
< some output omitted >- - - - - - - - - - - - - - - - - - - - - - - - - - - - - - - - - - - - - - - - - - - - - - - - - - - - - - - - - - - - Estimates for DIFFICULTY --- Individual univariate .9500 confidence intervals GROUP Parameter Coeff. Std. Err. t-Value Sig. t Lower -95% CL- Upper 2 -.6090908051 .87486 -.69622 .49165 -2.39579 1.17761 3 -.8181818182 .87486 -.93522 .35714 -2.60488 .96852 - - - - - - - - - - - - - - - - - - - - - - - - - - - - - - - - - - - - - - - - - - - - - - - - - - - - - - - - - - - - Estimates for USEFUL --- Individual univariate .9500 confidence intervals GROUP Parameter Coeff. Std. Err. t-Value Sig. t Lower -95% CL- Upper 2 -2.5909088308 1.33477 -1.94109 .06169 -5.31687 .13505 3 -2.7727272727 1.33477 -2.07731 .04643 -5.49869 -.04676 - - - - - - - - - - - - - - - - - - - - - - - - - - - - - - - - - - - - - - - - - - - - - - - - - - - - - - - - - - - - Estimates for IMPORTANCE --- Individual univariate .9500 confidence intervals GROUP Parameter Coeff. Std. Err. t-Value Sig. t Lower -95% CL- Upper 2 -3.5727272291 1.60750 -2.22253 .03393 -6.85569 -.28977 3 -3.0454544317 1.60750 -1.89452 .06783 -6.32841 .23750 - - - - - - - - - - - - - - - - - - - - - - - - - - - - - - - - - - - - - - - - - - - - - - - - - - - - - - - - - - - -< some output omitted >
Finally, let’s run separate univariate ANOVAs.
oneway useful difficulty importance by group.
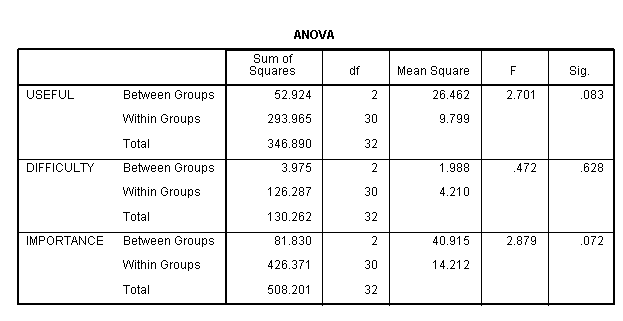
While none of the three ANOVAs were statistically significant at the alpha = .05 level,
in particular, the F-ratio for difficulty was less than 1.
Things to consider
- One of the assumptions of MANOVA is that the response variables come
from group populations that are multivariate normal distributed. This
means that each of the dependent variables is normally distributed within
group, that any linear combination of the dependent variables is normally
distributed, and that all subsets of the variables must be multivariate
normal. With
respect to Type I error rate, MANOVA tends to be robust to minor
violations of the multivariate normality assumption. - The homogeneity of population covariance matrices (a.k.a. sphericity) is another assumption.
This implies that the population variances and covariances of all dependent
variables must be equal in all groups formed by the independent variables. - Small samples can have low power, but if the multivariate normality assumption is met,
the MANOVA is generally more powerful than separate univariate tests. - There are at least five types of follow-up analyses that can be done
after a statistically significant MANOVA. These include multiple
univariate ANOVAs, stepdown analysis, discriminant analysis, dependent
variable contribution, and multivariate contrasts.
See also
References
- Grimm, L. G. and Yarnold, P. R. (editors). 1995. Reading
and Understanding Multivariate Statistics. Washington, D.C.:
American Psychological Association. - Huberty, C. J. and Olejnik, S. 2006. Applied MANOVA and
Discriminant Analysis, Second Edition. Hoboken, New Jersey: John
Wiley and Sons, Inc. - Stevens, J. P. 2002. Applied Multivariate Statistics for
the Social Sciences, Fourth Edition. Mahwah, New Jersey:
Lawrence Erlbaum Associates, Inc. - Tatsuoka, M. M. 1971. Multivariate Analysis:
Techniques for Educational and Psychological Research. New York:
John Wiley and Sons.