Table 10.1, page 327
We use the procedure output command to output the results of the survival command to a data set. However, there were some problems with the text data set, so we modified it before bringing it into SPSS.
get file 'c:aldateachers.sav'.

procedure output outfile=surv.
survival table = t
 /interval = thru 12 by 1
 /status = censor(0)
 /write=tables.

* NOTE that the text file SURV was modified and saved as SURV1.txt.

get data
 /type = txt
 /file = 'c:aldaSURV1.txt'
 /delimiters = " "
 /arrangement = delimited
 /variables =
 v1 f5.2
 v2 f7.2
 v3 f6.2
 v4 f6.2
 v5 f6.2.
execute.

save outfile 'c:aldasurv1.sav'
 /drop v4
 /rename v1=year v2=begin v3=censored v5=left.

get file 'c:aldasurv1.sav'.

compute p1 = left/begin.
do if $casenum = 1.
compute p2 = 1.
else.
compute temp = lag(p2).
compute p2 = (1-p1)*temp.
format p1 p2 (f6.4) year begin left (f4.0) censored (f3.0).
end if.
if $casenum = 1 p1 =$sysmis.
list year begin left censored p1 p2.
save outfile 'c:aldasurv2.sav'.
YEAR BEGIN LEFT CENSORED     P1     P2

   0  3941    0      0    .     1.0000
   1  3941  456      0    .1157  .8843
   2  3485  384      0    .1102  .7869
   3  3101  359      0    .1158  .6958
   4  2742  295      0    .1076  .6209
   5  2447  218      0    .0891  .5656
   6  2229  184      0    .0825  .5189
   7  2045  123    280    .0601  .4877
   8  1642   79    307    .0481  .4642
   9  1256   53    255    .0422  .4446
  10   948   35    265    .0369  .4282
  11   648   16    241    .0247  .4177
  12   391    5    386    .0128  .4123

Number of cases read:  13    Number of cases listed:  13
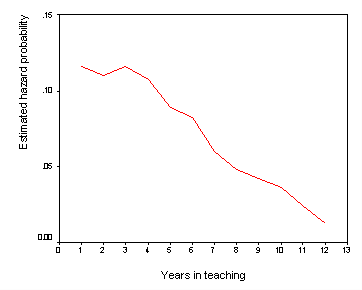
Figure 10.1, page 333
Top panel:
Bottom panel:
graph
 scatterplot(bivar) year with p2.
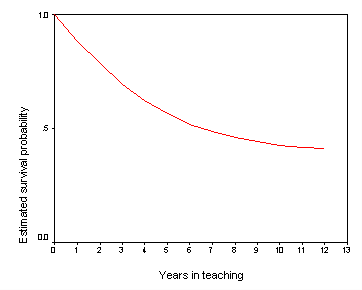
Figure 10.2, page 340
Panel A:
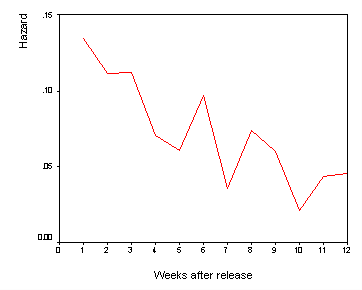
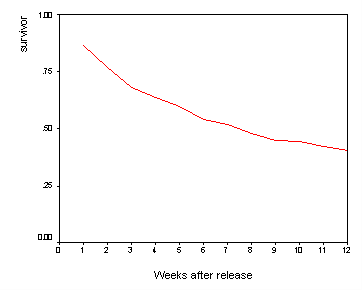
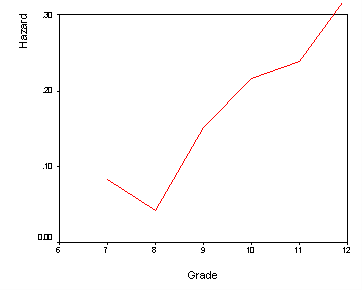
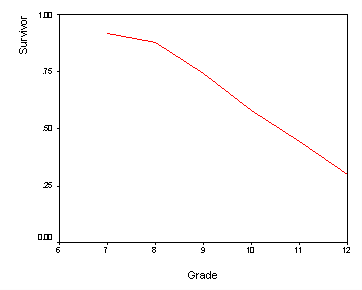
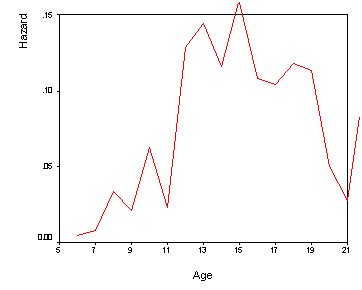
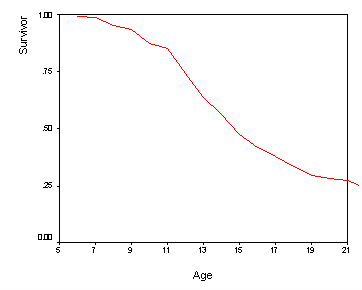
The procedure output command is necessary because of the /write=all subcommand in the crosstabs command. This allows the contents of the crosstab to be output to a data file (in text format). The get data command reads in the text file and the casestovars command reshapes the data. The variables are then renamed and the total, hazard and survivor functions are computed. Finally, the graphs are created.
get file 'c:aldacocaine_relapse_pp.sav'.

procedure output outfile=panela.
crosstabs
 /tables period by event
 /cells = count row
 /write = all.

get data
 /type = txt
 /file = 'c:aldaPANELA'
 /delimiters = " "
 /arrangement = delimited
 /variables =
 v1 f1.0
 v2 f1.0
 v3 f2.1
 v4 f5.2
 v5 f4.2.
execute.

sort cases by v4 v5.
casestovars
 /id = v4
 /index = v5.

rename variables v4=period v3..00=event0 v3.1.00=event1.
compute total = event0+event1.
compute hazard = event1/total.
compute survivor = 1-hazard.
do if $casenum >=2.
compute t1= lag(survivor).
compute survivor = t1* (1-hazard).
end if.
execute.

graph
 /scatterplot(bivar) = period with hazard.
graph
 /scatterplot(bivar) = period with survivor.
Panel B:
get file 'c:aldafirstsex_pp.sav'.

procedure output outfile=panelb.
crosstabs
 /tables period by event
 /cells = count row
 /write = all.

get data
 /type = txt
 /file = 'c:aldaPANELB'
 /delimiters = " "
 /arrangement = delimited
 /variables =
 v1 f1.0
 v2 f1.0
 v3 f2.1
 v4 f5.2
 v5 f4.2.
execute.

sort cases by v4 v5.
casestovars
 /id = v4
 /index = v5.

rename variables v4=period v3..00=event0 v3.1.00=event1.
compute total = event0+event1.
compute hazard = event1/total.
compute survivor = 1-hazard.
do if $casenum >=2.
compute t1= lag(survivor).
compute survivor = t1* (1-hazard).
end if.
execute.

graph
 /scatterplot(bivar) = period with hazard.
graph
 /scatterplot(bivar) = period with survivor.
Panel C:
get file 'c:aldasuicide_pp.sav'.

procedure output outfile=panelc.
crosstabs
 /tables period by event
 /cells = count row
 /write = all.

get data
 /type = txt
 /file = 'c:aldaPANELC'
 /delimiters = " "
 /arrangement = delimited
 /variables =
 v1 f1.0
 v2 f1.0
 v3 f2.1
 v4 f5.2
 v5 f4.2.
execute.

sort cases by v4 v5.
casestovars
 /id = v4
 /index = v5.

rename variables v4=period v3..00=event0 v3.1.00=event1.
compute total = event0+event1.
compute hazard = event1/total.
compute survivor = 1-hazard.
do if $casenum >=2.
compute t1= lag(survivor).
compute survivor = t1* (1-hazard).
end if.
execute.

graph
 /scatterplot(bivar) = period with hazard.
graph
 /scatterplot(bivar) = period with survivor.
Panel D:
get file 'c:aldacongress_pp.sav'.

procedure output outfile=paneld.
crosstabs
 /tables period by event
 /cells = count row
 /write = all.

get data
 /type = txt
 /file = 'c:aldaPANELD'
 /delimiters = " "
 /arrangement = delimited
 /variables =
 v1 f1.0
 v2 f1.0
 v3 f2.1
 v4 f5.2
 v5 f4.2.
execute.

sort cases by v4 v5.
casestovars
 /id = v4
 /index = v5.

rename variables v4=period v3..00=event0 v3.1.00=event1.
compute total = event0+event1.
compute hazard = event1/total.
compute survivor = 1-hazard.
do if $casenum >=2.
compute t1= lag(survivor).
compute survivor = t1* (1-hazard).
end if.
execute.

graph
 /scatterplot(bivar) = period with hazard.
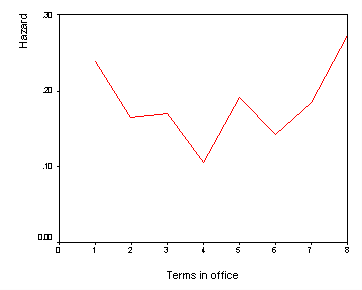
graph
 /scatterplot(bivar) = period with survivor.
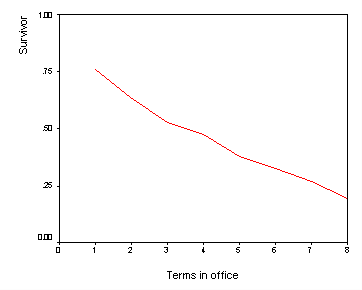
Table 10.2, page 349
get file 'c:aldasurv2.sav'.

compute sehaz = sqrt(((p1)*(1-p1))/begin).
do if $casenum = 1.
compute term = 0.
else.
compute tlag = lag(term).
compute term = (p1/(begin*(1-p1))) + tlag.
end if.
compute sesurv = p2*sqrt(term).
format begin (f4.0) p1 p2 sehaz  term sesurv (f9.7).
list year begin p1 sehaz p2 term sesurv
 /cases = from 2 to 13.
YEAR BEGIN        P1     SEHAZ        P2      TERM    SESURV

  1   3941  .1157067  .0050954  .8842933  .0000332  .0050954
  2   3485  .1101865  .0053041  .7868561  .0000687  .0065235
  3   3101  .1157691  .0057455  .6957625  .0001110  .0073288
  4   2742  .1075857  .0059173  .6209084  .0001549  .0077283
  5   2447  .0890887  .0057588  .5655925  .0001949  .0078958
  6   2229  .0825482  .0058290  .5189038  .0002353  .0079590
  7   2045  .0601467  .0052576  .4876935  .0002665  .0079622
  8   1642  .0481121  .0052812  .4642295  .0002973  .0080048
  9   1256  .0421975  .0056727  .4446402  .0003324  .0081067
 10    948  .0369198  .0061243  .4282242  .0003728  .0082687
 11    648  .0246914  .0060962  .4176508  .0004119  .0084765
 12    391  .0127877  .0056822  .4123100  .0004450  .0086981


Number of cases read:  13    Number of cases listed:  12
Table 10.3, page 355
get file 'c:aldateachers_pp.sav'.

procedure output outfile=celldata.
crosstabs
 /tables = period by event
 /cells = row
 /write = cells.

get data
 /type = txt
 /file = 'c:aldaCELLDATA'
 /delimiters = " "
 /arrangement = delimited
 /variables =
 v1 f1.0
 v2 f1.0
 v3 f3.2
 v4 f5.2
 v5 f4.2.
execute.

sort cases by v4 v5.
casestovars
 /id = v4
 /index = v5
 /groupby = variable.

rename variable (v3..00=event0) (v3.1.00=event1).
compute total = event0 + event1.
compute prop = event1/total.
compute period = $casenum.
format prop (F6.4) period event0 event1 total (F4.0) .
list period event0 event1 total prop.
PERIOD EVENT0 EVENT1 TOTAL   PROP

    1   3485    456   3941  .1157
    2   3101    384   3485  .1102
    3   2742    359   3101  .1158
    4   2447    295   2742  .1076
    5   2229    218   2447  .0891
    6   2045    184   2229  .0825
    7   1922    123   2045  .0601
    8   1563     79   1642  .0481
    9   1203     53   1256  .0422
   10    913     35    948  .0369
   11    632     16    648  .0247
   12    386      5    391  .0128

Number of cases read:  12    Number of cases listed:  12
