The entire program is at aldaspssch3.sps
Table 3.1, page 48
compute filter = 0.
if any(id,68,70,71,72,902,904,906,908) filter = 1.
filter by filter.
list id age cog program.
execute.
use all.
      ID      AGE      COG  PROGRAM

   68.00     1.00   103.00     1.00
   68.00     1.50   119.00     1.00
   68.00     2.00    96.00     1.00
   70.00     1.00   106.00     1.00
   70.00     1.50   107.00     1.00
   70.00     2.00    96.00     1.00
   71.00     1.00   112.00     1.00
   71.00     1.50    86.00     1.00
   71.00     2.00    73.00     1.00
   72.00     1.00   100.00     1.00
   72.00     1.50    93.00     1.00
   72.00     2.00    87.00     1.00
  902.00     1.00   119.00      .00
  902.00     1.50    93.00      .00
  902.00     2.00    99.00      .00
  904.00     1.00   112.00      .00
  904.00     1.50    98.00      .00
  904.00     2.00    79.00      .00
  906.00     1.00    89.00      .00
  906.00     1.50    66.00      .00
  906.00     2.00    81.00      .00
  908.00     1.00   117.00      .00
  908.00     1.50    90.00      .00
  908.00     2.00    76.00      .00


Number of cases read:  24    Number of cases listed:  24
Figure 3.1, page 50
compute filter = 0.
if any(id,68,70,71,72,902,904,906,908) filter = 1.
filter by filter.

formats age (f4.1) cog (f4.0) id (f2.0).

GGRAPH
  /GRAPHDATASET NAME="iGraphDataset" VARIABLES= cog age id
  /GRAPHSPEC SOURCE=INLINE
INLINETEMPLATE=["<setWrapPanels/>"].
BEGIN GPL
SOURCE: s=userSource( id( "iGraphDataset" ) )
DATA: cog=col( source(s), name( "cog" ) )
DATA: age=col( source(s), name( "age" ) )
DATA: id=col( source(s), name( "id" ), unit.category() )
GUIDE: text.title( label( "Figure 3.1" ) )
GUIDE: axis( dim( 1 ), label( "age" ), delta(.5) )
GUIDE: axis( dim( 2 ), label( "cog" ), delta(25) )
GUIDE: axis( dim( 3 ), label( "id" ), opposite() )
SCALE: linear( dim( 1 ), min(1), max(2) )
SCALE: linear( dim( 2 ), min(50), max(150) )
ELEMENT: point( position( ( age * cog * id ) ) )
ELEMENT: line( position(smooth.linear( age * cog * id) ))
END GPL.

use all.
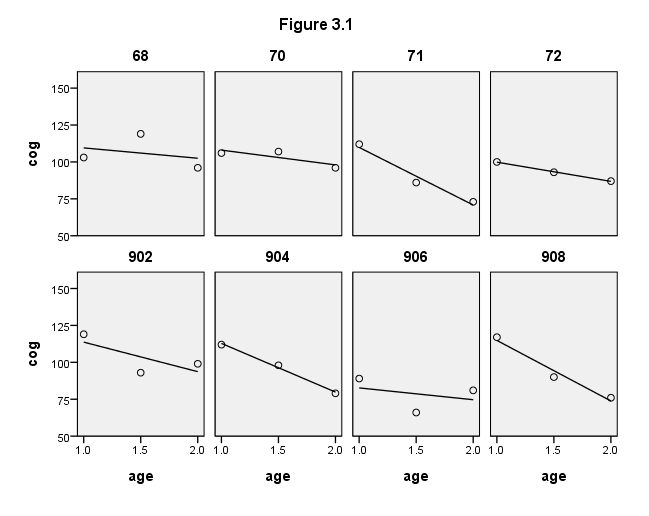
Figure 3.3, page 57
NOTE: We did not reproduce the stem-and-leaf plots at the bottom of this figure.
formats age (f4.1) cog (f4.0).
GGRAPH
  /GRAPHDATASET NAME="iGraphDataset" VARIABLES= cog age id
  /GRAPHSPEC SOURCE=INLINE .
BEGIN GPL
SOURCE: s=userSource( id( "iGraphDataset" ) )
DATA: cog=col( source(s), name( "cog" ) )
DATA: age=col( source(s), name( "age" ) )
DATA: id=col( source(s), name( "id" ), unit.category() )
GUIDE: axis( dim( 1 ), label( "age" ), delta(.5) )
GUIDE: axis( dim( 2 ), label( "cog" ), delta(25) )
GUIDE: legend(aesthetic(aesthetic.shape), null())
SCALE: linear( dim( 1 ), min(1), max(2) )
SCALE: linear( dim( 2 ), min(50), max(150) )
ELEMENT: line( position(smooth.linear( age * cog ) ), shape(id))
END GPL.
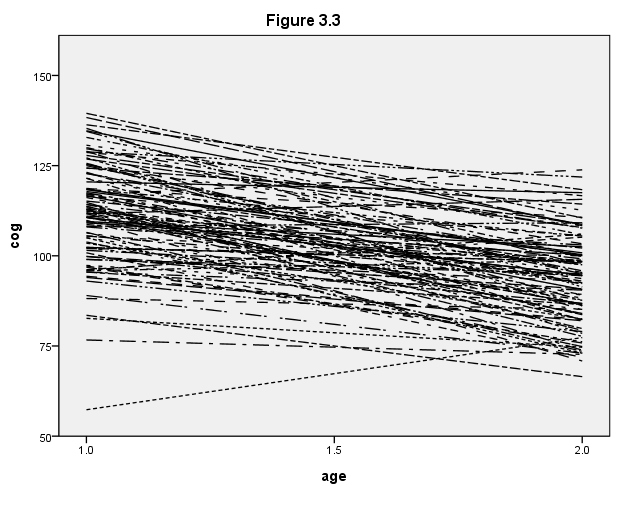
Figure 3.4, page 59
use all.
value labels program 0 "program = 0" 1 "program = 1".

GGRAPH
  /GRAPHDATASET NAME="iGraphDataset" VARIABLES= cog age id program
  /GRAPHSPEC SOURCE=INLINE .
BEGIN GPL
SOURCE: s=userSource( id( "iGraphDataset" ) )
DATA: cog=col( source(s), name( "cog" ) )
DATA: age=col( source(s), name( "age" ) )
DATA: id=col( source(s), name( "id" ), unit.category() )
DATA: program=col( source(s), name( "program" ), unit.category() )
GUIDE: text.title( label( "Figure 3.4" ) )
GUIDE: axis( dim( 1 ), label( "age" ), delta(.5) )
GUIDE: axis( dim( 2 ), label( "cog" ), delta(25) )
GUIDE: axis( dim( 3 ), label( " " ), opposite() )
GUIDE: legend(aesthetic(aesthetic.shape), null())
SCALE: linear( dim( 1 ), min( 1 ), max( 2 ) )
SCALE: linear( dim( 2 ), min( 50 ), max( 150 ) )
ELEMENT: line( position(smooth.linear( age * cog * program) ), shape(id))
ELEMENT: line( position(summary.mean( age * cog * program)), color(color.red) )
END GPL.
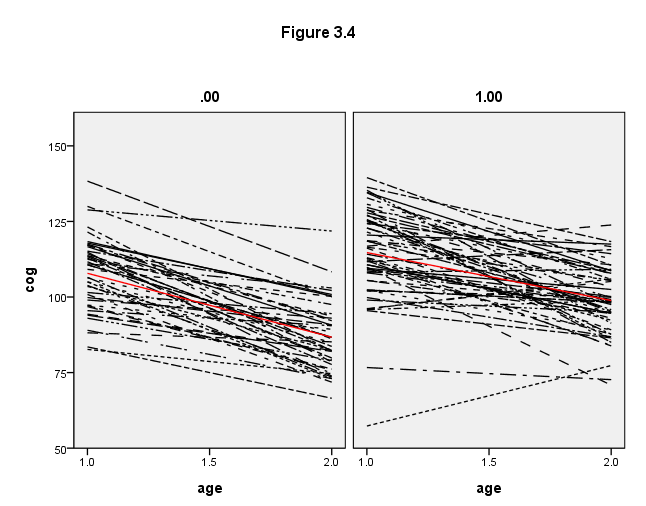
Table 3.3, page 69
We first need to create a centered age variable, which we called time1. We also need to include the /criteria = mxstep(50) subcommand so that the model converges.
compute time1 = age - 1.
execute.

mixed cog with time1 program
 /print = solution
 /method = ml
 /criteria = mxstep(50)
 /fixed = time1 program time1*program
 /random intercept time1 | subject(id) covtype(un).

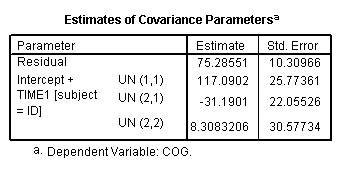
Figure 3.5, page 71
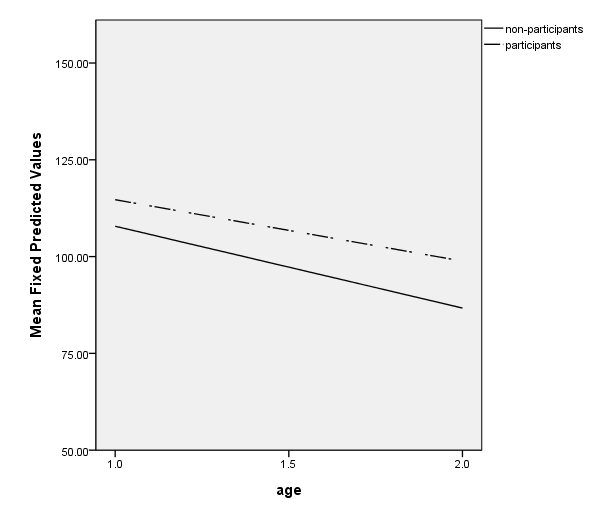
To create the graph, you need to get the predicted values from the regression. First, we create an interaction term, timeprog, using the compute command. Next, we run the regression using time, program and timeprog as predictors and saving the predicted values with the /save subcommand (pred is the SPSS keyword for saving the predicted values). Finally, we use pred, the name of the new variable given in the parentheses, in the ggraph command.
compute timeprog = time*program.
regression
 /dependent cog
 /method = enter time program timeprog
 /save pred (pred).

value labels program 0 "non-participants" 1 "participants".

GGRAPH
  /GRAPHDATASET NAME="graphdataset" VARIABLES=age MEAN(pred)[name="MEAN_pred"] program
  /GRAPHSPEC SOURCE=INLINE.
BEGIN GPL
SOURCE: s=userSource(id("graphdataset"))
DATA: age=col(source(s), name("age"))
DATA: MEAN_pred=col(source(s), name("MEAN_pred"))
DATA: program=col(source(s), name("program"), unit.category())
GUIDE: axis(dim(1), label("age"), delta(.5))
GUIDE: axis(dim(2), label("Mean Fixed Predicted Values"), delta(25))
GUIDE: legend(aesthetic(aesthetic.color.interior), label("program"))
SCALE: linear(dim(1), min(1), max(2))
SCALE: linear(dim(2), min(50), max(150))
ELEMENT: line(position(age*MEAN_pred), shape(program))
END GPL.
