Figure 4.1, page 77
get file ="c:aldaalcohol1_pp.sav".

compute filt=0.
if any(id,4,14,23,32,41,56,65,82) filt=1.
execute.
filter by filt.
value labels age_14 0 "14" 1 "15" 2 "16".
formats alcuse (f3.0) id (f2.0).
GGRAPH
  /GRAPHDATASET NAME="GraphDataset" VARIABLES= alcuse age_14 id
  /GRAPHSPEC SOURCE=INLINE INLINETEMPLATE=["<setWrapPanels/>"].
BEGIN GPL
SOURCE: s=userSource( id( "GraphDataset" ) )
DATA: alcuse=col( source(s), name( "alcuse" ) )
DATA: age_14=col( source(s), name( "age_14" ), unit.category() )
DATA: id=col( source(s), name( "id" ), unit.category() )
GUIDE: axis( dim( 1 ), label( "Age" ) )
GUIDE: axis( dim( 2 ), label( "alcuse" ) )
GUIDE: axis( dim( 3 ), label( "id" ), opposite() )
ELEMENT: point( position( ( age_14 * alcuse * id ) ) )
ELEMENT: line( position(smooth.linear( age_14 * alcuse * id) ))
END GPL.
filter off.
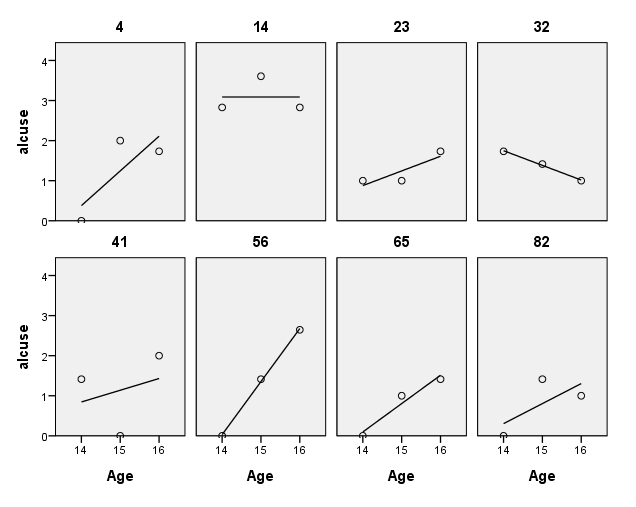
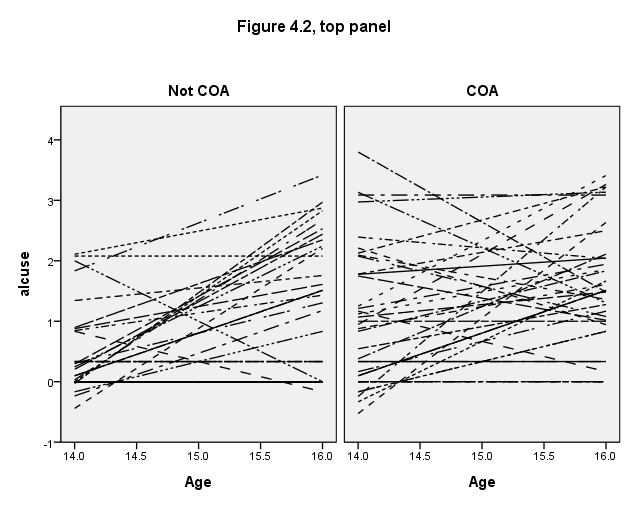
Figure 4.2, upper panel, page 79
Note that this shows the graphs for all of the subjects, not just a sample, so the results are somewhat different from the text.
value labels coa 0 "Not COA" 1 "COA".
formats age (f2.1).
GGRAPH
  /GRAPHDATASET NAME="graphdataset" VARIABLES=age alcuse coa id
  /GRAPHSPEC SOURCE=INLINE.
BEGIN GPL
SOURCE: s=userSource(id("graphdataset"))
DATA: age=col(source(s), name("age"))
DATA: alcuse=col(source(s), name("alcuse"))
DATA: coa=col(source(s), name("coa"), unit.category())
DATA: id=col( source(s), name( "id" ), unit.category() )
GUIDE: text.title(label("Figure 4.2, top panel"))
GUIDE: axis(dim(1), label("Age"))
GUIDE: axis(dim(2), label("alcuse"))
GUIDE: axis(dim(3), label(" "), opposite())
GUIDE: legend(aesthetic(aesthetic.shape), null())
SCALE: linear( dim( 1 ), min(14), max(16))
SCALE: linear( dim( 2 ), min(-1), max(4))
ELEMENT: line( position(smooth.linear( age * alcuse * coa) ), shape(id))
END GPL.
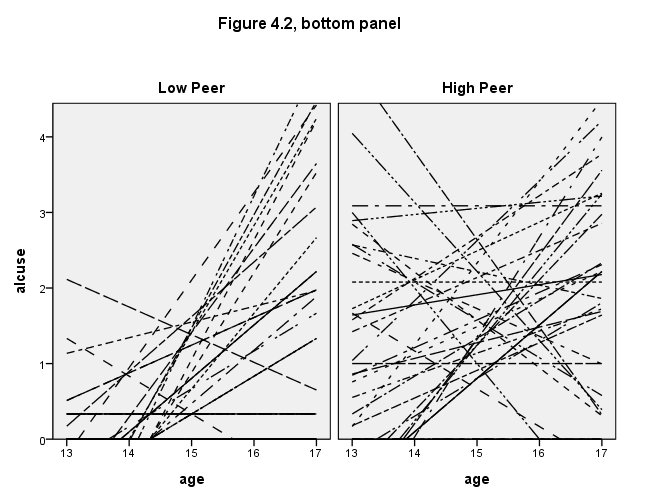
Figure 4.2, lower panel, page 79
compute hipeer=0.
if (peer > 1.0175595) hipeer=1.
value labels hipeer 0 "Low Peer" 1 "High Peer".

formats age alcuse (f3.0).
GGRAPH
  /GRAPHDATASET NAME="graphdataset" VARIABLES=age alcuse hipeer id
  /GRAPHSPEC SOURCE=INLINE.
BEGIN GPL
SOURCE: s=userSource(id("graphdataset"))
DATA: age=col(source(s), name("age"))
DATA: alcuse=col(source(s), name("alcuse"))
DATA: hipeer=col(source(s), name("hipeer"), unit.category())
DATA: id=col( source(s), name( "id" ), unit.category() )
GUIDE: legend(aesthetic(aesthetic.shape), null())
GUIDE: text.title(label("Figure 4.2, bottom panel"))
GUIDE: axis(dim(1), label("age"))
GUIDE: axis(dim(2), label("alcuse"), delta(1))
GUIDE: axis(dim(3), label(" "), opposite())
SCALE: linear(dim(1), min(13), max(17))
ELEMENT: line( position(smooth.linear( age * alcuse * hipeer) ), shape(id))
END GPL.
Table 4.1, pages 94-95
title "Model A".
mixed alcuse
  /print=solution
  /method=ml
  /fixed=intercept
  /random intercept | subject(id).

title "Model B".
mixed alcuse with age_14
  /print=solution
  /method=ml
  /fixed = age_14
  /random intercept age_14 | subject(id) covtype(un).

title "Model C".
mixed alcuse with coa age_14
  /print=solution
  /method=ml
  /fixed = coa age_14 coa*age_14
  /random intercept age_14 | subject(id) covtype(un).

title "Model D".
mixed alcuse with coa peer age_14
  /print=solution
  /method=ml
  /fixed = coa peer age_14 coa*age_14 peer*age_14
  /random intercept age_14 | subject(id) covtype(un).

title "Model E".
mixed alcuse with coa peer age_14
  /print=solution
  /method=ml
  /fixed = coa peer age_14 peer*age_14
  /random intercept age_14 | subject(id) covtype(un).

title "Model F".
mixed alcuse with coa cpeer age_14
  /print=solution
  /method=ml
  /fixed = coa cpeer age_14 cpeer*age_14
  /random intercept age_14 | subject(id) covtype(un).

title "Model G".
mixed alcuse with ccoa cpeer age_14
  /print=solution
  /method=ml
  /fixed = ccoa cpeer age_14 cpeer*age_14
  /random intercept age_14 | subject(id) covtype(un).
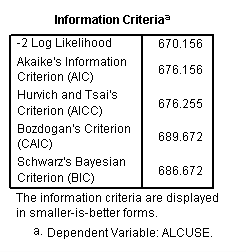


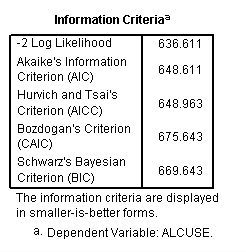

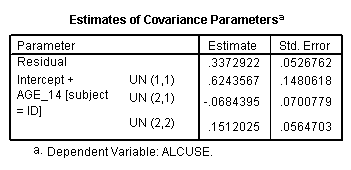
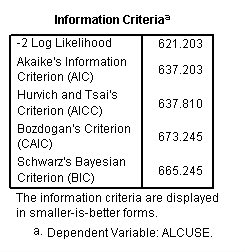

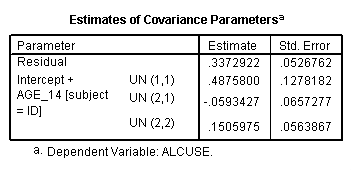
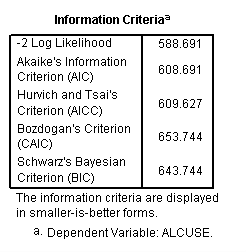

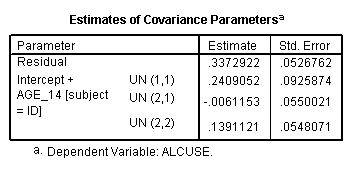
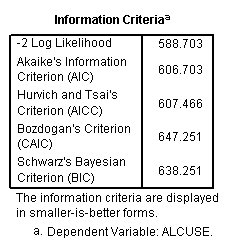

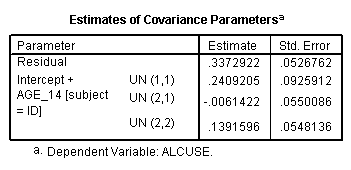
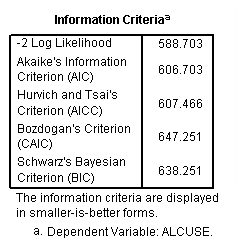

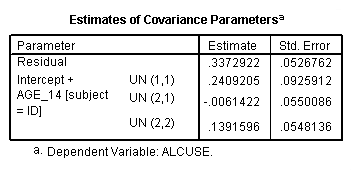
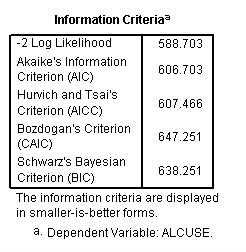

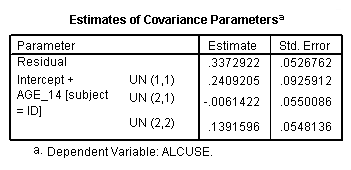
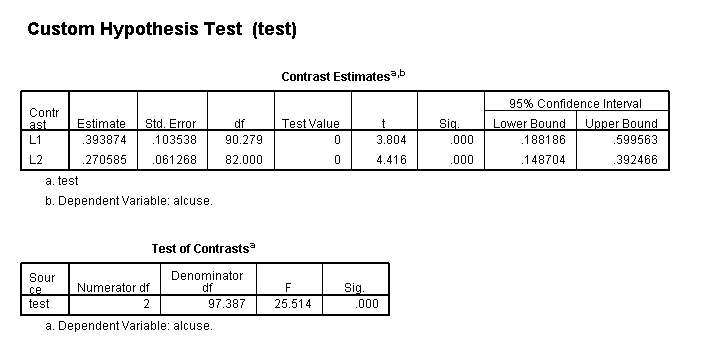
Test of equation 4.18 on page 123 using model F.
title "Model F".
mixed alcuse with coa cpeer age_14
  /print=solution
  /method=ml
  /fixed = coa cpeer age_14 cpeer*age_14
  /random intercept age_14 | subject(id) covtype(un)
  /test 'test' intercept 1; age_14 1 .

