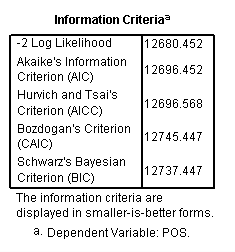
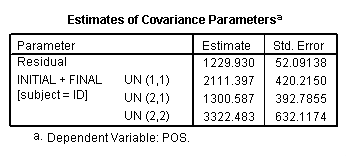
Table 5.1, page 141
NLSY Reading study: 89 African American children
get file = "c:aldareading_pp.sav".
compute filt=0.
if any(id,04,27,31,33,41,49,69,77,87) filt=1.
execute.
filter by filt.
list /var=id wave agegrp age piat.
filter off.
ID    WAVE AGEGRP AGE PIAT
4.00  1.00  6.50  6.00 18.00
4.00  2.00  8.50  8.50 31.00
4.00  3.00 10.50 10.67 50.00
27.00 1.00  6.50  6.25 19.00
27.00 2.00  8.50  9.17 36.00
27.00 3.00 10.50 10.92 57.00
31.00 1.00  6.50  6.33 18.00
31.00 2.00  8.50  8.83 31.00
31.00 3.00 10.50 10.92 51.00
33.00 1.00  6.50  6.33 18.00
33.00 2.00  8.50  8.92 34.00
33.00 3.00 10.50 10.75 29.00
41.00 1.00  6.50  6.33 18.00
41.00 2.00  8.50  8.75 28.00
41.00 3.00 10.50 10.83 36.00
49.00 1.00  6.50  6.50 19.00
49.00 2.00  8.50  8.75 32.00
49.00 3.00 10.50 10.67 48.00
69.00 1.00  6.50  6.67 26.00
69.00 2.00  8.50  9.17 47.00
69.00 3.00 10.50 11.33 45.00
77.00 1.00  6.50  6.83 17.00
77.00 2.00  8.50  8.08 19.00
77.00 3.00 10.50 10.00 28.00
87.00 1.00  6.50  6.92 22.00
87.00 2.00  8.50  9.42 49.00
87.00 3.00 10.50 11.50 64.00

Number of cases read: 27 Number of cases listed: 27
Figure 5.1, page 143 skipped for now.
Table 5.2, page 145
Alternative representations for the main effect of TIME and using AGEGRP-6.5 as a temporal predictor.
compute cage=age-6.5.
compute cagegrp=agegrp-6.5.
execute.
mixed piat with cagegrp
  /print=solution
  /method=ml
  /fixed=intercept cagegrp
  /random=intercept cagegrp | subject(id) covtype(un).
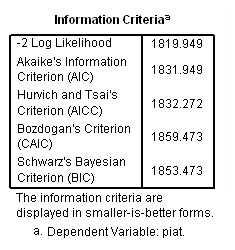

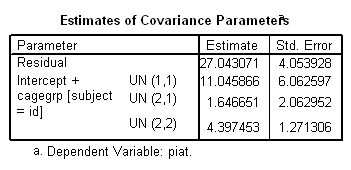
Using AGE-6.5 as a temporal predictor.
mixed piat with cage
  /print=solution
  /method=ml
  /fixed=intercept cage
  /random=intercept cage | subject(id) covtype(un).
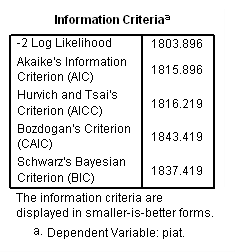

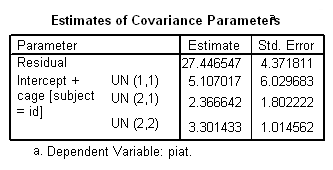
Table 5.3, page 147
Excerpts from the person-period data set for the high school dropout study.
get file = "c:aldawages_pp.sav".
compute filt=0.
if any(id,206,332,1028) filt=1.
execute.
filter by filt.
list /var=id exper lnw black hgc uerate.
filter off.
    ID EXPER LNW BLACK HGC  UERATE
   206.00 1.87 2.03  .00 10.00  9.20
   206.00 2.81 2.30  .00 10.00 11.00
   206.00 4.31 2.48  .00 10.00  6.30
   332.00  .13 1.63  .00  8.00  7.10
   332.00 1.63 1.48  .00  8.00  9.60
   332.00 2.41 1.80  .00  8.00  7.20
   332.00 3.39 1.44  .00  8.00  6.20
   332.00 4.47 1.75  .00  8.00  5.60
   332.00 5.18 1.53  .00  8.00  4.60
   332.00 6.08 2.04  .00  8.00  4.30
   332.00 7.04 2.18  .00  8.00  3.40
   332.00 8.20 2.19  .00  8.00  4.39
   332.00 9.09 4.04  .00  8.00  6.70
    1028.00  .00  .87 1.00  8.00  9.30
    1028.00  .04  .90 1.00  8.00  7.40
    1028.00  .52 1.39 1.00  8.00  7.30
    1028.00 1.48 2.32 1.00  8.00  7.40
    1028.00 2.14 1.48 1.00  8.00  6.30
    1028.00 3.16 1.71 1.00  8.00  5.90
    1028.00 4.10 2.34 1.00  8.00  6.90

    Number of cases read: 20 Number of cases listed: 20
Table 5.4, page 149
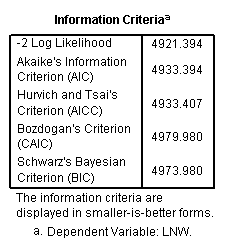
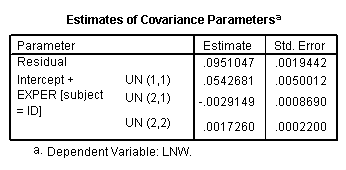
Model A: Unconditional growth model
mixed lnw with exper
  /print=solution
  /method=ml
  /fixed=intercept exper
  /random=intercept exper | subject(id) covtype(un).

Model B: Effects of Black and HGC on both initial status and growth rate
mixed lnw with exper hgc_9 black
  /print=solution
  /method=ml
  /fixed=exper hgc_9 hgc_9*exper black black*exper
  /random=intercept exper | subject(id) covtype(un).
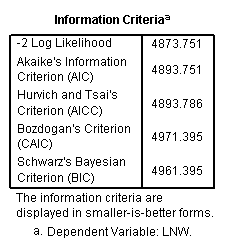

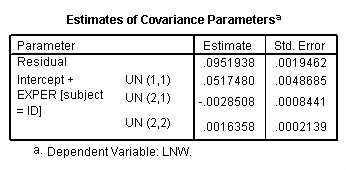
Model C: HGC predicts initial status/BLACK predicts growth rate
mixed lnw with exper hgc_9 black
  /print=solution
  /method=ml
  /fixed=exper hgc_9 black*exper
  /random=intercept exper | subject(id) covtype(un).
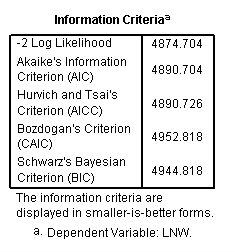

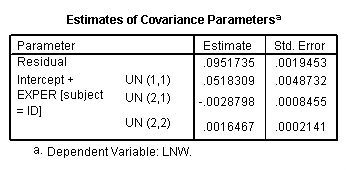
Figure 5.2, page 150 Skipped for now.
Table 5.5: Severely unbalanced data: Alternative approaches to model fitting
get file = "c:aldawages_small_pp.sav".
Table 5.5, pate 154
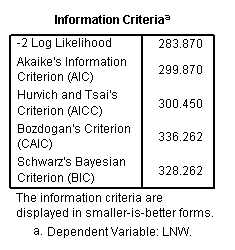
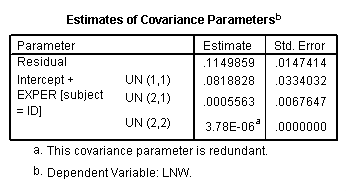
Model A. Default method
mixed lnw with exper hgc_9 black
  /print=solution
  /method=ml
  /fixed=exper hgc_9 black*exper
  /random=intercept exper | subject(id) covtype(un).
NOTE SPSS REPORTS FINAL HESSIAN IS NOT POSITIVE DEFINITE!


Model B: Removing boundary constraints to allow negative variances
* ??? Not sure how to do this in SPSS.
Model C: Fixing rates of change
mixed lnw with exper hgc_9 black
  /print=solution
  /method=ml
  /fixed=exper hgc_9 black*exper
  /random=intercept | subject(id) covtype(un).
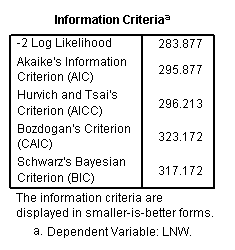


Table 5.6, page 161
Excerpts from the person-period data set for the unemployment study
get file = "c:aldaunemployment_pp.sav".
compute filt=0.
if any(id,7589,55697,67641,65441,53782) filt=1.
execute.
filter by filt.
list /var=id months cesd unemp.
filter off.
      ID   MONTHS
  CESD    UNEMP

   7589.00     1.31    36.00
  1.00
   7589.00     5.09    40.00
  1.00
   7589.00    11.79    39.00
  1.00
  53782.00      .43    22.00
  1.00
  53782.00     4.24    15.00
  .00
  53782.00    11.07    21.00
  1.00
  55697.00     1.35     7.00
  1.00
  55697.00     5.78     4.00
  1.00
  65441.00     1.08    27.00
  1.00
  65441.00     4.70    15.00
  1.00
  65441.00    11.27     7.00
  .00
  67641.00      .33    32.00
  1.00
  67641.00     4.11     9.00
  .00
  67641.00    10.94    10.00
  .00

  Number of cases read:  14    Number of cases listed:
  14
Table 5.7, page 163
Taxonomy of models of unemployment data.
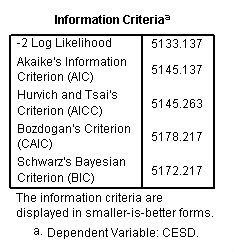
Model A: Initial growth model
mixed cesd with months
  /print=solution
  /method=ml
  /fixed= months
  /random=intercept months | subject(id) covtype(un).

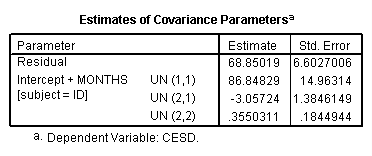
Model B: Main effect of unemployment
mixed cesd with months unemp
  /print=solution
  /method=ml
  /fixed=intercept months unemp
  /random=intercept months | subject(id) covtype(un).
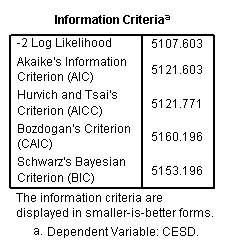


Model C: Effect of unemployment on initial status and growth rate
mixed cesd with months unemp
  /print=solution
  /method=ml
  /fixed=intercept months unemp unemp*months
  /random=intercept months | subject(id) covtype(un).
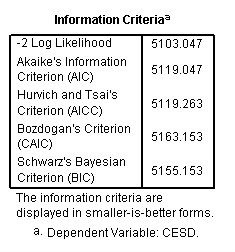

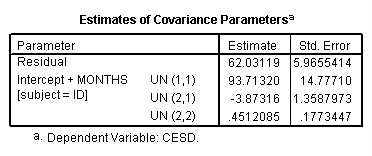
Model D: Allowing unemployment to have both fix and random effects
Note that we needed to add /criteria mxstep(100) to get the model to converge, and that the -2LL and some of the estimates differ somewhat from the values in the book.
mixed
cesd with months unemp
  /print=solution
  /criteria mxstep(100)
  /method=ml
  /fixed=intercept  unemp unemp*months
  /random=intercept unemp unemp*months | subject(id) covtype(un).
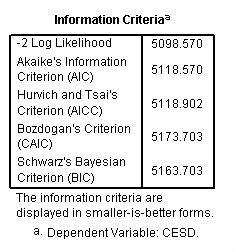

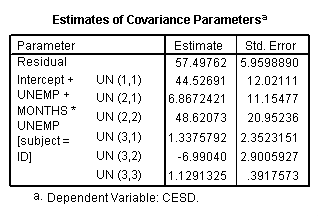
Figure 5.3, page 165 Skipped for now.
Figure 5.4, page 167 Skipped for now.
Table 5.8, page 175
High school dropout wage data–Effects of time-varying unemployment rate.
get file = "c:aldawages_pp.sav".
Model A: Unemployment rate centered around 7
mixed lnw with hgc_9 ue_7 exper black
  /print=solution
  /method=ml
  /fixed=intercept hgc_9 ue_7 exper black*exper
  /random=intercept exper | subject(id) covtype(un).
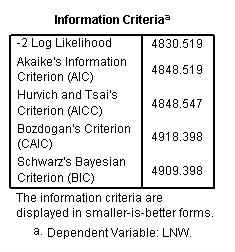

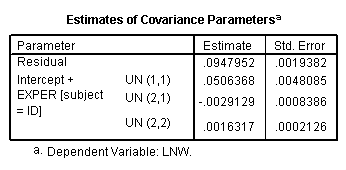
Model B: Within context centering
mixed lnw with hgc_9 ue_mean ue_perso exper black
  /print=solution
  /method=ml
  /fixed=intercept hgc_9 ue_mean ue_perso exper black*exper
  /random=intercept exper | subject(id) covtype(un).
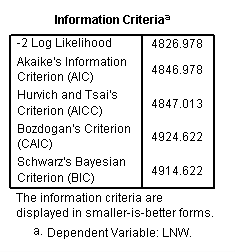

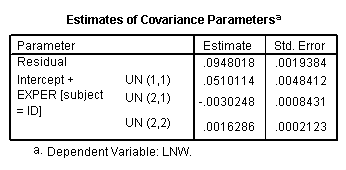
Model C: Centering on time-1
mixed lnw with hgc_9 ue1 ue_cente exper black
  /print=solution
  /method=ml
  /fixed=intercept hgc_9 ue1 ue_cente exper black*exper
  /random=intercept exper | subject(id) covtype(un).
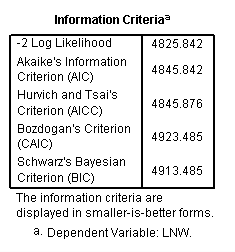

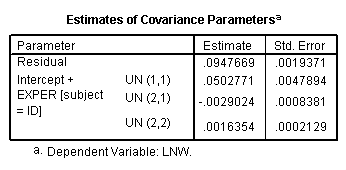
Table 5.9, page 182 Skipped for now.
Table 5.10, page 184
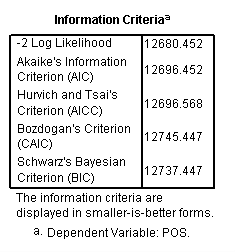
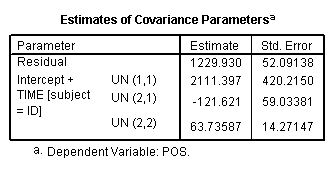
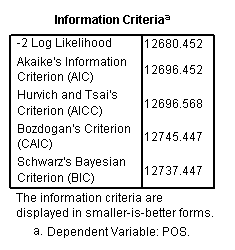
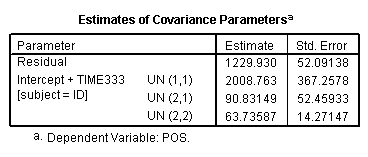
Alternative parameterizations for the main effect of TIME in the antidepressant trial.
get file="c:aldamedication_pp.sav".
Model A: TIME
mixed pos with treat time
  /print=solution
  /method=ml
  /fixed=intercept treat time treat*time
  /random=intercept time | subject(id) covtype(un).

Model B: TIME-3.33
mixed pos with treat time333
  /print=solution
  /method=ml
  /fixed=intercept treat time333 treat*time333
  /random=intercept time333 | subject(id) covtype(un).

Model C: TIME-6.67
mixed pos with treat time667
  /print=solution
  /method=ml
  /fixed=intercept treat time667 treat*time667
  /random=intercept time667 | subject(id) covtype(un).
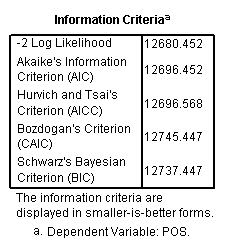

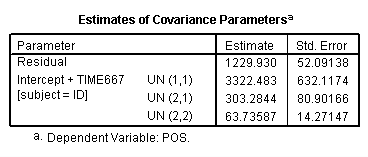
Figure 5.5, page 185 Skipped for now.
page 188
Initial and final status model
mixed pos with Initial treat final
  /print=solution
  /method=ml
  /fixed=Initial treat*initial final treat*final | noint
  /random=initial final | subject(id) covtype(un).
