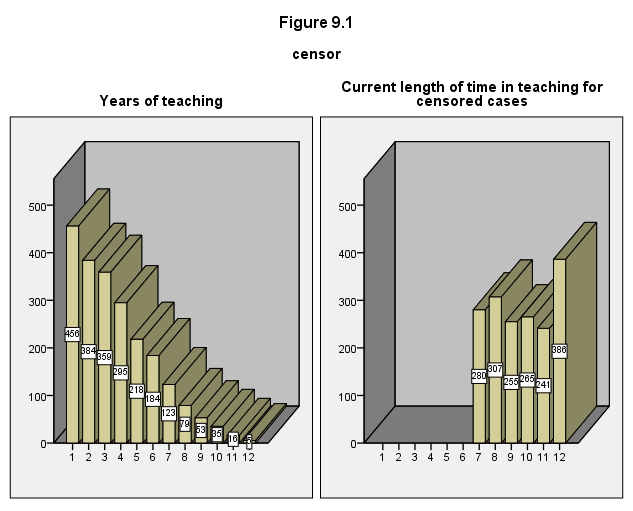
Figure 9.1 on page 321.
GET FILE='c:aldateachers.sav'.
formats t (f2.0).
value labels censor 0 "Years of teaching" 1 "Current length of time in teaching for censored cases".
GGRAPH
  /GRAPHDATASET NAME="graphdataset" VARIABLES=t COUNT()[name="COUNT"] censor
  /GRAPHSPEC SOURCE=INLINE  INLINETEMPLATE=
["<addBarEffects applyToNonBar='true' depth='100%'  foreshortening='0.2' theta='50' />"
 "<addDataLabels><labeling variable='count'></labeling></addDataLabels>" ].
BEGIN GPL
SOURCE: s=userSource(id("graphdataset"))
DATA: t=col(source(s), name("t"), unit.category())
DATA: COUNT=col(source(s), name("COUNT"))
DATA: censor=col(source(s), name("censor"), unit.category())
GUIDE: text.title( label( "Figure 9.1" ) )
GUIDE: axis(dim(3), label("censor"), opposite())
SCALE: linear(dim(2), include(0))
ELEMENT: interval(position(t*COUNT*censor), shape.interior(shape.square))
END GPL.