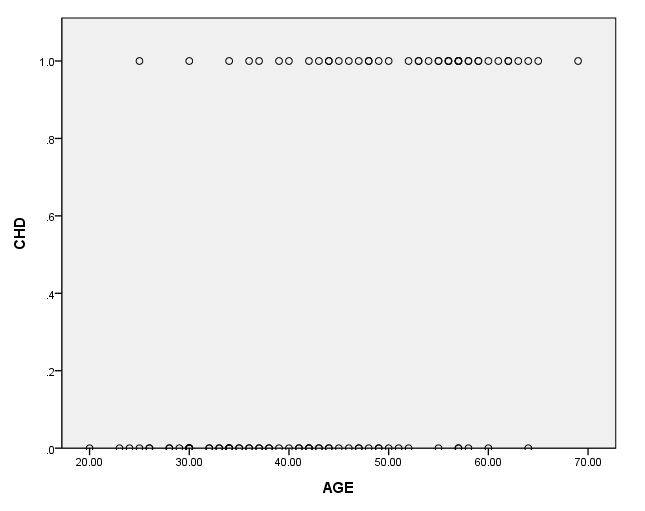
page 3 Table 1.1 Age and coronary heart disease (CHD) status of 100 subjects.
Get file='chdage.sav'.

compute agrp=age.
recode agrp (20 thru 29=1)(30 thru 34=2)(35 thru 39=3)(40 thru 44=4)(45 thru 49=5)(50 thru 54=6)(55 thru 59=7)(60 thru 69=8).
execute.

list id age agrp chd.


       ID       AGE     AGRP       CHD

     1.00     20.00     1.00       .00
     2.00     23.00     1.00       .00
     3.00     24.00     1.00       .00
     4.00     25.00     1.00       .00
     5.00     25.00     1.00      1.00
     6.00     26.00     1.00       .00
     7.00     26.00     1.00       .00
     8.00     28.00     1.00       .00
     9.00     28.00     1.00       .00
    10.00     29.00     1.00       .00
    11.00     30.00     2.00       .00
    12.00     30.00     2.00       .00
    13.00     30.00     2.00       .00
    14.00     30.00     2.00       .00
    15.00     30.00     2.00       .00
    16.00     30.00     2.00      1.00
    17.00     32.00     2.00       .00
    18.00     32.00     2.00       .00
    19.00     33.00     2.00       .00
    20.00     33.00     2.00       .00
    21.00     34.00     2.00       .00
    22.00     34.00     2.00       .00
    23.00     34.00     2.00      1.00
    24.00     34.00     2.00       .00
    25.00     34.00     2.00       .00
    26.00     35.00     3.00       .00
    27.00     35.00     3.00       .00
    28.00     36.00     3.00       .00
    29.00     36.00     3.00      1.00
    30.00     36.00     3.00       .00
    31.00     37.00     3.00       .00
    32.00     37.00     3.00      1.00
    33.00     37.00     3.00       .00
    34.00     38.00     3.00       .00
    35.00     38.00     3.00       .00
    36.00     39.00     3.00       .00
    37.00     39.00     3.00      1.00
    38.00     40.00     4.00       .00
    39.00     40.00     4.00      1.00
    40.00     41.00     4.00       .00
    41.00     41.00     4.00       .00
    42.00     42.00     4.00       .00
    43.00     42.00     4.00       .00
    44.00     42.00     4.00       .00
    45.00     42.00     4.00      1.00
    46.00     43.00     4.00       .00
    47.00     43.00     4.00       .00
    48.00     43.00     4.00      1.00
    49.00     44.00     4.00       .00
    50.00     44.00     4.00       .00

       ID       AGE     AGRP       CHD

    51.00     44.00     4.00      1.00
    52.00     44.00     4.00      1.00
    53.00     45.00     5.00       .00
    54.00     45.00     5.00      1.00
    55.00     46.00     5.00       .00
    56.00     46.00     5.00      1.00
    57.00     47.00     5.00       .00
    58.00     47.00     5.00       .00
    59.00     47.00     5.00      1.00
    60.00     48.00     5.00       .00
    61.00     48.00     5.00      1.00
    62.00     48.00     5.00      1.00
    63.00     49.00     5.00       .00
    64.00     49.00     5.00       .00
    65.00     49.00     5.00      1.00
    66.00     50.00     6.00       .00
    67.00     50.00     6.00      1.00
    68.00     51.00     6.00       .00
    69.00     52.00     6.00       .00
    70.00     52.00     6.00      1.00
    71.00     53.00     6.00      1.00
    72.00     53.00     6.00      1.00
    73.00     54.00     6.00      1.00
    74.00     55.00     7.00       .00
    75.00     55.00     7.00      1.00
    76.00     55.00     7.00      1.00
    77.00     56.00     7.00      1.00
    78.00     56.00     7.00      1.00
    79.00     56.00     7.00      1.00
    80.00     57.00     7.00       .00
    81.00     57.00     7.00       .00
    82.00     57.00     7.00      1.00
    83.00     57.00     7.00      1.00
    84.00     57.00     7.00      1.00
    85.00     57.00     7.00      1.00
    86.00     58.00     7.00       .00
    87.00     58.00     7.00      1.00
    88.00     58.00     7.00      1.00
    89.00     59.00     7.00      1.00
    90.00     59.00     7.00      1.00
    91.00     60.00     8.00       .00
    92.00     60.00     8.00      1.00
    93.00     61.00     8.00      1.00
    94.00     62.00     8.00      1.00
    95.00     62.00     8.00      1.00
    96.00     63.00     8.00      1.00
    97.00     64.00     8.00       .00
    98.00     64.00     8.00      1.00
    99.00     65.00     8.00      1.00
   100.00     69.00     8.00      1.00

Number of cases read:  100    Number of cases listed:  100
page 4 Figure 1.1 Scatterplot of CHD by AGE for 100 subjects.
formats chd (f2.1) age (2.0).
GGRAPH
  /GRAPHDATASET NAME="GraphDataset" VARIABLES= chd age
  /GRAPHSPEC SOURCE=INLINE .
BEGIN GPL
SOURCE: s=userSource( id( "GraphDataset" ) )
DATA: chd=col( source(s), name( "chd" ) )
DATA: age=col( source(s), name( "age" ) )
GUIDE: axis( dim( 1 ), label( "AGE" ) )
GUIDE: axis( dim( 2 ), label( "Percent with CHD" ) )
ELEMENT: point( position( age * chd ) )
END GPL.

page 4 Table 1.2 Frequency table of age group by CHD.
CROSSTABS
  /TABLES=agrp BY chd
  /FORMAT= AVALUE TABLES
  /CELLS= COUNT.
| |
Cases | |||||
|---|---|---|---|---|---|---|
| Valid | Missing | Total | ||||
| N | Percent | N | Percent | N | Percent | |
| AGRP * CHD | 100 | 100.0% | 0 | .0% | 100 | 100.0% |
| |
CHD | Total | ||
|---|---|---|---|---|
| .00 | 1.00 | |||
| AGRP | 1.00 | 9 | 1 | 10 |
| 2.00 | 13 | 2 | 15 | |
| 3.00 | 9 | 3 | 12 | |
| 4.00 | 10 | 5 | 15 | |
| 5.00 | 7 | 6 | 13 | |
| 6.00 | 3 | 5 | 8 | |
| 7.00 | 4 | 13 | 17 | |
| 8.00 | 2 | 8 | 10 | |
| Total | 57 | 43 | 100 | |
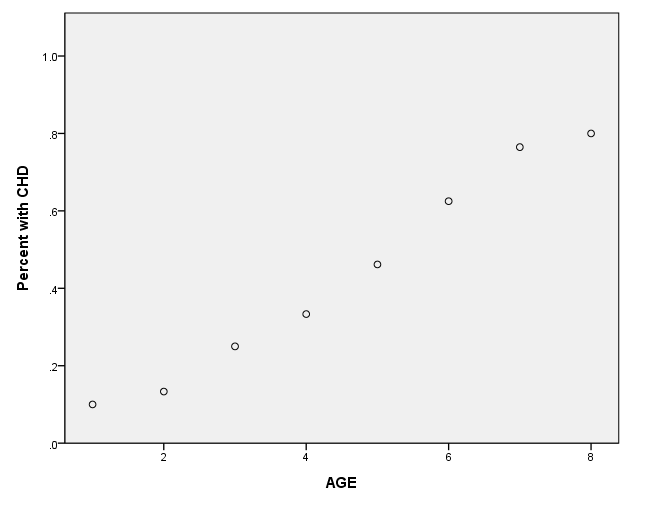
page 5 Figure 1.2 Plot of the percentage of subjects with CHD in each age group.
NOTE: agrp was used to make this graph instead of age as in the text.
aggregate outfile='table12.sav' / break=agrp / totn=n(chd) / present=sum(chd). execute.get file='table12.sav'.
compute prop=present/totn.
formats agrp (f1.0) prop (f2.1). GGRAPH /GRAPHDATASET NAME="GraphDataset" VARIABLES= prop agrp /GRAPHSPEC SOURCE=INLINE . BEGIN GPL SOURCE: s=userSource( id( "GraphDataset" ) ) DATA: prop=col( source(s), name( "prop" ) ) DATA: agrp=col( source(s), name( "agrp" ) ) GUIDE: axis( dim( 1 ), label( "AGE" ) ) GUIDE: axis( dim( 2 ), label( "Percent with CHD" ) ) SCALE: linear( dim( 1 ) ) SCALE: linear( dim( 2 ), min(0), max(1) ) ELEMENT: point( position( agrp * prop ) ) END GPL.

page 10 Table 1.3 Results of fitting the logistic regression model to the data in Table 1.1.
get file='chdage.sav'.LOGISTIC REGRESSION VAR=chd /METHOD=ENTER age.
| Unweighted Cases(a) | N | Percent | |
|---|---|---|---|
| Selected Cases | Included in Analysis | 100 | 100.0 |
| Missing Cases | 0 | .0 | |
| Total | 100 | 100.0 | |
| Unselected Cases | 0 | .0 | |
| Total | 100 | 100.0 | |
| a If weight is in effect, see classification table for the total number of cases. | |||
| Original Value | Internal Value |
|---|---|
| .00 | 0 |
| 1.00 | 1 |
| |
Predicted | ||||
|---|---|---|---|---|---|
| CHD | Percentage Correct | ||||
| Observed | .00 | 1.00 | |||
| Step 0 | CHD | .00 | 57 | 0 | 100.0 |
| 1.00 | 43 | 0 | .0 | ||
| Overall Percentage | |
|
57.0 | ||
| a Constant is included in the model. | |||||
| b The cut value is .500 | |||||
| |
B | S.E. | Wald | df | Sig. | Exp(B) | |
|---|---|---|---|---|---|---|---|
| Step 0 | Constant | -.282 | .202 | 1.947 | 1 | .163 | .754 |
| |
Score | df | Sig. | ||
|---|---|---|---|---|---|
| Step 0 | Variables | AGE | 26.399 | 1 | .000 |
| Overall Statistics | 26.399 | 1 | .000 | ||
| |
Chi-square | df | Sig. | |
|---|---|---|---|---|
| Step 1 | Step | 29.310 | 1 | .000 |
| Block | 29.310 | 1 | .000 | |
| Model | 29.310 | 1 | .000 | |
| Step | -2 Log likelihood | Cox & Snell R Square | Nagelkerke R Square |
|---|---|---|---|
| 1 | 107.353 | .254 | .341 |
| |
Predicted | ||||
|---|---|---|---|---|---|
| CHD | Percentage Correct | ||||
| Observed | .00 | 1.00 | |||
| Step 1 | CHD | .00 | 45 | 12 | 78.9 |
| 1.00 | 14 | 29 | 67.4 | ||
| Overall Percentage | |
|
74.0 | ||
| a The cut value is .500 | |||||
| |
B | S.E. | Wald | df | Sig. | Exp(B) | |
|---|---|---|---|---|---|---|---|
| Step 1(a) | AGE | .111 | .024 | 21.254 | 1 | .000 | 1.117 |
| Constant | -5.309 | 1.134 | 21.935 | 1 | .000 | .005 | |
| a Variable(s) entered on step 1: AGE. | |||||||
page 20 Table 1.4 Estimated covariance matrix of the estimated coefficients in Table 1.3.
LOGISTIC REGRESSION VAR=chd
  /METHOD=ENTER age
  /PRINT=SUMMARY corr.
| Unweighted Cases(a) | N | Percent | |
|---|---|---|---|
| Selected Cases | Included in Analysis | 100 | 100.0 |
| Missing Cases | 0 | .0 | |
| Total | 100 | 100.0 | |
| Unselected Cases | 0 | .0 | |
| Total | 100 | 100.0 | |
| a If weight is in effect, see classification table for the total number of cases. | |||
| Original Value | Internal Value |
|---|---|
| .00 | 0 |
| 1.00 | 1 |
| |
Predicted | ||||
|---|---|---|---|---|---|
| CHD | Percentage Correct | ||||
| Observed | .00 | 1.00 | |||
| Step 0 | CHD | .00 | 57 | 0 | 100.0 |
| 1.00 | 43 | 0 | .0 | ||
| Overall Percentage | |
|
57.0 | ||
| a Constant is included in the model. | |||||
| b The cut value is .500 | |||||
| |
B | S.E. | Wald | df | Sig. | Exp(B) | |
|---|---|---|---|---|---|---|---|
| Step 0 | Constant | -.282 | .202 | 1.947 | 1 | .163 | .754 |
| |
Score | df | Sig. | ||
|---|---|---|---|---|---|
| Step 0 | Variables | AGE | 26.399 | 1 | .000 |
| Overall Statistics | 26.399 | 1 | .000 | ||
| |
Chi-square | df | Sig. | |
|---|---|---|---|---|
| Step 1 | Step | 29.310 | 1 | .000 |
| Block | 29.310 | 1 | .000 | |
| Model | 29.310 | 1 | .000 | |
| Step | -2 Log likelihood | Cox & Snell R Square | Nagelkerke R Square |
|---|---|---|---|
| 1 | 107.353 | .254 | .341 |
| |
Predicted | ||||
|---|---|---|---|---|---|
| CHD | Percentage Correct | ||||
| Observed | .00 | 1.00 | |||
| Step 1 | CHD | .00 | 45 | 12 | 78.9 |
| 1.00 | 14 | 29 | 67.4 | ||
| Overall Percentage | |
|
74.0 | ||
| a The cut value is .500 | |||||
| |
B | S.E. | Wald | df | Sig. | Exp(B) | |
|---|---|---|---|---|---|---|---|
| Step 1(a) | AGE | .111 | .024 | 21.254 | 1 | .000 | 1.117 |
| Constant | -5.309 | 1.134 | 21.935 | 1 | .000 | .005 | |
| a Variable(s) entered on step 1: AGE. | |||||||
| |
Constant | AGE | |
|---|---|---|---|
| Step 1 | Constant | 1.000 | -.978 |
| AGE | -.978 | 1.000 | |
NOTE: for the variances: var=(se)**2.
NOTE: for the covariances: cov=corr*se*se.
age/age: (.024)**2 = .000579
constant/constant: (1.134)**2 = 1.218517
age/constant: (-.978)*(.024)*(1.134) = -0.026677
