The whas100, whas500, actg320, gbcs, and uis data sets are used in this chapter.
Table 4.2 on page 97 using the whas100 dataset.
get file ='C:Dataasa2whas100.sav'.
coxreg
  foltime  /status=folstatus(1)
  /method = enter  gender.


Table 4.3 on page 98 using the actg320 dataset.
get file ='C:Dataasa2actg320.sav'.
coxreg time
/status = censor(1)
/method = enter tx.


Table 4.4 on page 99 and Table 4.5 on page 101 using the whas100 dataset.
get file ='C:Dataasa2whas100.sav'.
compute age2 = (age>=60 & age<=69).
compute age3 = (age>=70 & age <=79).
compute age4 = (age>=80).
exe.
coxreg foltime
/status=folstatus(1)
/method = enter  age2 age3 age4
/print = default ci.


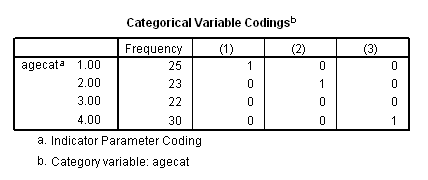
Alternatively, we can create a categorical variable for age group and make use of the rich contrast statement that SPSS offers.
if (age<60) agecat = 1.
if (age>=60 & age<=69) agecat = 2.
if (age>=70 & age <=79) agecat = 3.
if (age>=80) agecat = 4.
exe.

coxreg foltime  with  agecat
/status=folstatus(1)
/categorical = agecat
/contrast(agecat) = indicator(1)
/print = default ci.
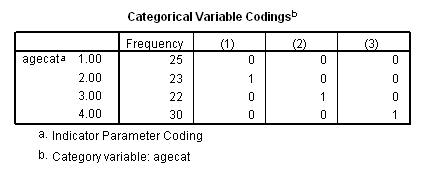

The difference between age group 3 and age group 2 using the contrast statement.
coxreg foltime  with  agecat
/status=folstatus(1)
/categorical = agecat
/contrast(agecat) = indicator(3)
/print = default ci.
Table 4.7 on page 102. We need to get the covariance matrix for the three estimated coefficients in Table 4.5. SPSS does not return the full covariance matrix. Instead, it gives a lower part of the correlation matrix. We have to compute the full covariance matrix based on this correlation matrix and the standard errors for the parameter estimates. This is done making use of both OMS and the matrix language of SPSS. We are using the whas100 dataset and the model from the previous example.
oms
/select tables
/if
   subtypes = ['Correlation Matrix of Regression Coefficients']
/destination format = sav
outfile  = 'c:dataasa2corr_table4_7.sav'.
oms
/select tables
/if
   subtypes =  ['Variables in the Equation']
/destination format = sav
outfile  = 'c:dataasa2parms_table4_7.sav'.
coxreg foltime
/method = enter age2 age3 age4
/status folstatus(1)
/print = corr.
omsend.

matrix.
get corr /file="c:dataasa2corr_table4_7.sav"
 /variables=age2 age3
/missing = 0.

compute d=nrow(corr).
compute a = make(d+1, d+1, 0).
loop i = 1 to d.
   loop j = i+1 to d+1.
     compute a(i, j) = corr(j-1, i).
     compute a(j, i) =corr(j-1, i).
   end loop.
end loop.
compute c = ident(d+1) + a.

get se /file="c:dataasa2parms_table4_7.sav"
/variables = se.
compute sigma=mdiag(se).
compute cov = sigma*c*sigma.
print cov.
end matrix.
COV
   .2689919851   .1259938985   .1251235682
   .1259938985   .1983542137   .1260336740
   .1251235682   .1260336740   .1726740755
Table 4.8 on page 105 using the deviation coding scheme on the whas100 dataset.
coxreg foltime  with  agecat
/status=folstatus(1)
/categorical = agecat
/contrast(agecat) = deviation(1).
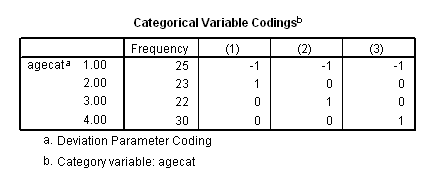

Table 4.9 on page 107 using the whas100 dataset.
coxreg foltime  with  age
/status=folstatus(1)
/print = default ci.
Table 4.10 on page 107 using the actg320 dataset.
get file ='C:Dataasa2actg320.sav'.
coxreg time
/status=censor(1)
/method = enter  cd4
/print = default ci.
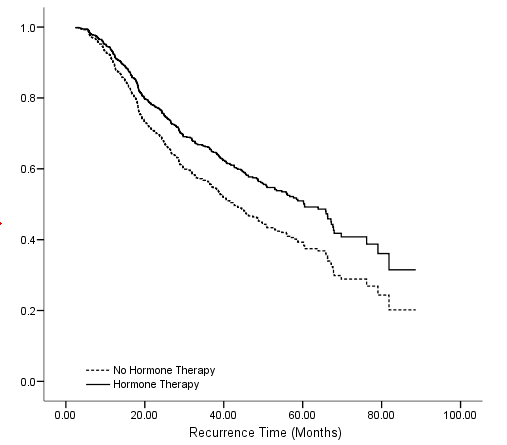
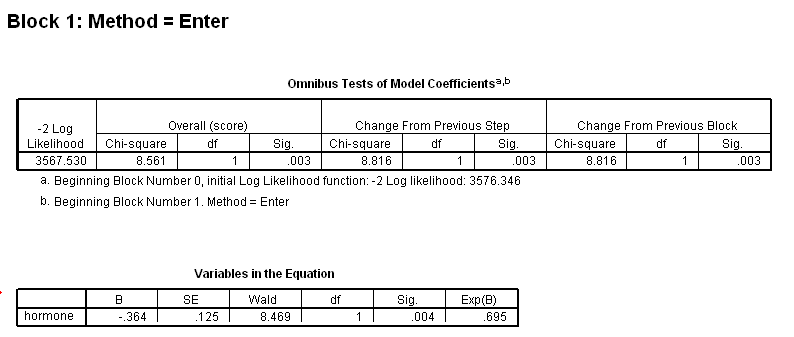
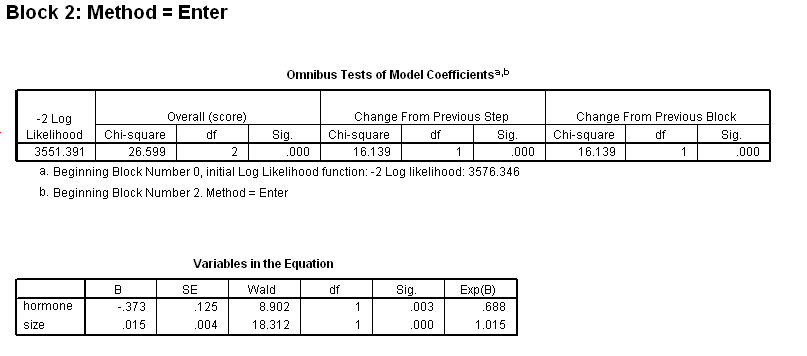
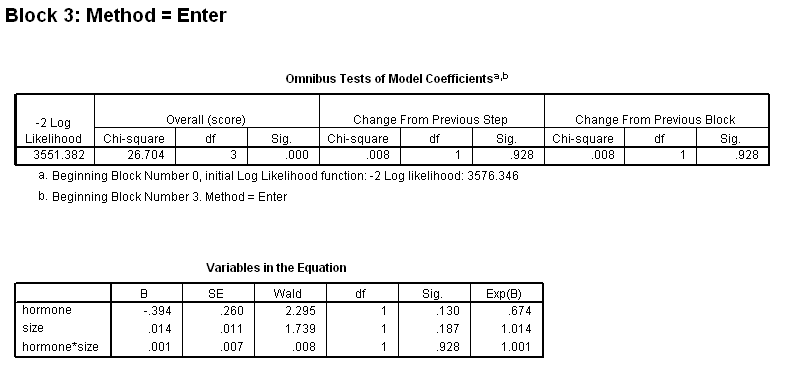
Table 4.11 on page 113 using gbcs dataset.
get file ='C:Dataasa2gbcs.sav'.

coxreg rectime
/status=censrec(1)
/method = enter  hormone
/method = enter hormone size
/method = enter hormone size hormone*size
/print = default ci.
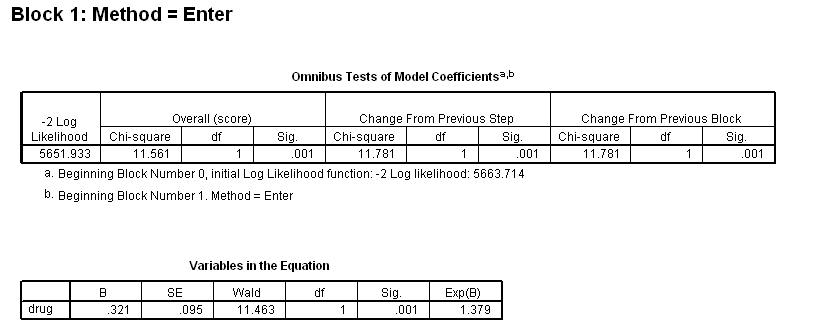
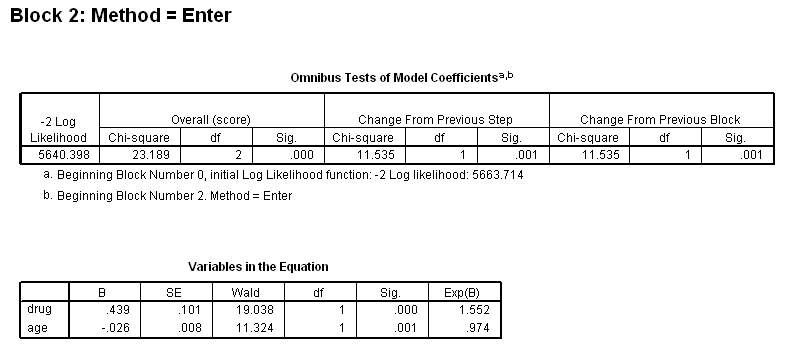
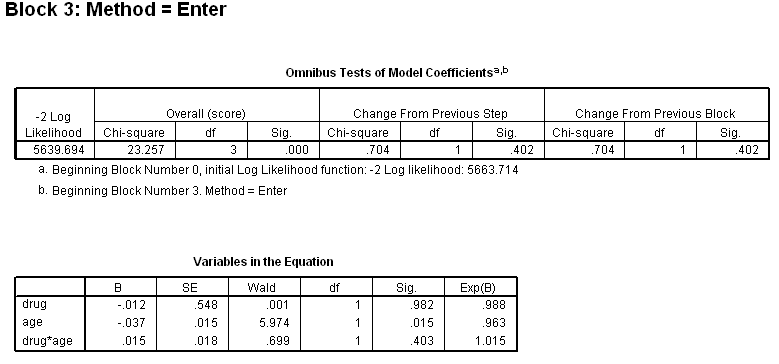
Table 4.12 on page 114 using the uis dataset.
get file='C:Dataasa2uis.sav'.

use all.
compute filter_$=( ~ sysmis(age) & ~ sysmis(ivhx)).
filter by filter_$.
exe.
compute drug =(ivhx=2 | ivhx=3).
exe.

coxreg time
/status=censor(1)
/method = enter  drug
/method = enter  drug age
/method = enter  drug age drug*age.
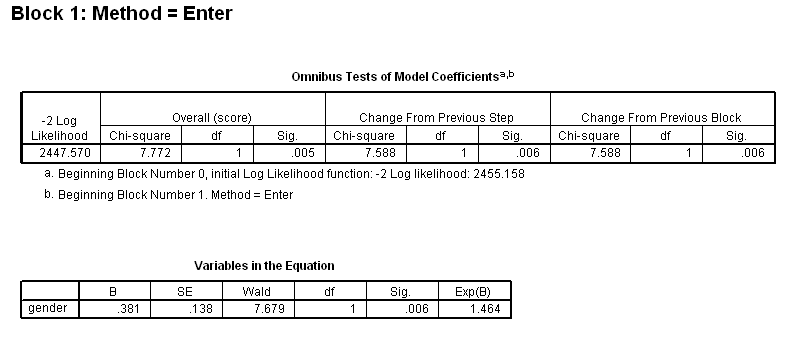
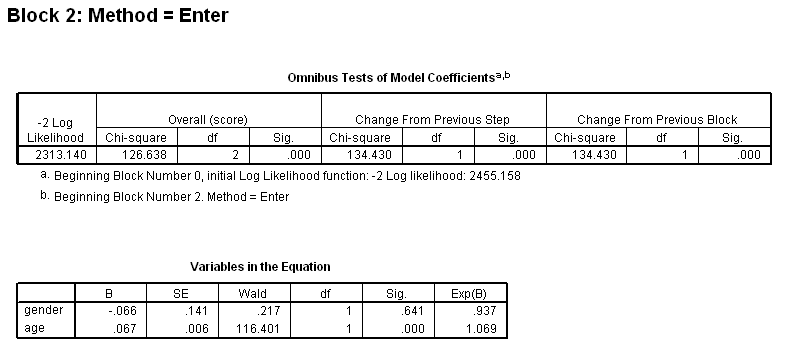
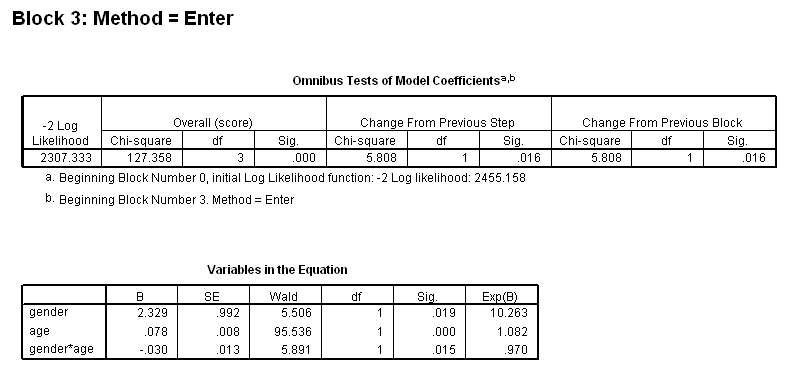
Table 4.13 on page 116 using the whas500 dataset.
get file ='C:Dataasa2whas500.sav'.

coxreg lenfol
/status=fstat(1)
/method = enter gender
/method = enter gender age
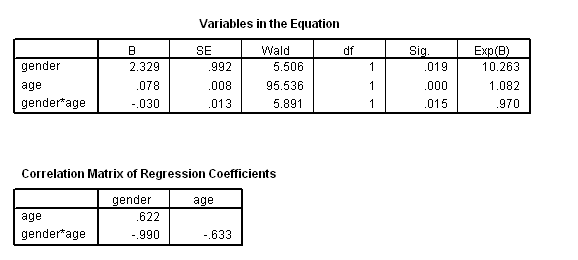
/method = enter gender age gender*age.
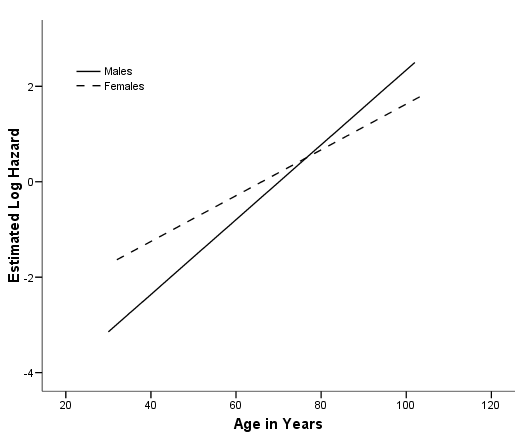
Figure 4.2 on page 117 using the model from above. Notice that the log hazard has been mean-adjusted by SPSS. To avoid this mean adjustment, we can manually generate the predicted log of hazard using the parameter estimates as shown below.
coxreg lenfol
/status=fstat(1)
/method = enter gender age gender*age
/save xbeta(xbeta).

graph
/scatterplot(bivar)=age with xbeta by gender.
*without mean adjustment.
compute loghz =  2.329*gender + .078*age  - .030*gender*age.
graph /scatterplot(bivar)=age with loghz by gender.
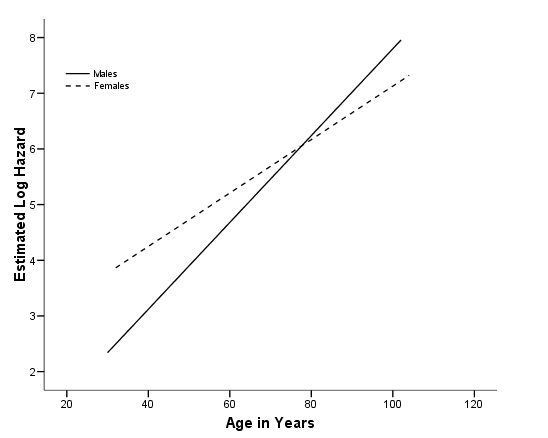
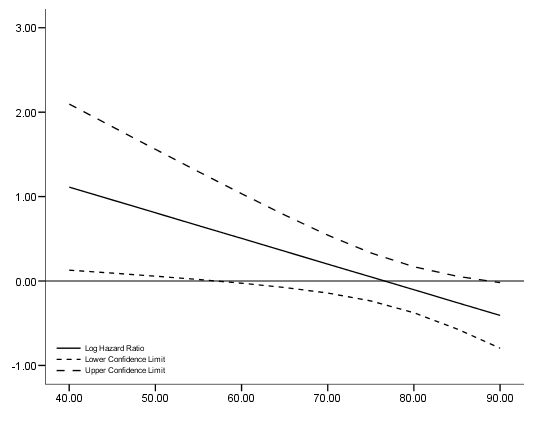
Figure 4.3 and Table 4.14 on page 118, continuing the previous example. To get the variance-covariance of the parameter estimates, we output the correlation matrix of the regression coefficients and calculate the covariance based on the correlation.
get file ='C:Dataasa2whas500.sav'.
coxreg lenfol
/status=fstat(1)
/method = enter gender age gender*age
/print = default corr.
data list free
/age.
begin data
40 45 50 55 60 65 70 75 80 85 90
end data.

*Creating the variance and covariance matrix.
compute #vgender  = .9923**2.
compute #vage     = .008**2.
compute #vaxg     = .0125**2.

compute #cov_a_g    = .6621*sqrt((#vage)*(#vgender)).
compute #cov_a_axg  =-.6333*sqrt((#vage)*(#vaxg)).
compute #cov_g_axg  =-.9903*sqrt((#vgender)*(#vaxg)).

compute log_hr = 2.3285 + age*(-.0304).
compute se = sqrt(#vgender + age**2*(#vaxg) + 2*age*#cov_g_axg).
compute log_hr_l = log_hr - 1.96*se.
compute log_hr_u = log_hr + 1.96*se.
exe.

graph
/scatterplot(overlay) = age age age with log_hr log_hr_l log_hr_u (pair).
compute hr = exp(log_hr).
compute hr_l = exp(log_hr_l).
compute hr_u = exp(log_hr_u).

list
/variable = age hr hr_l hr_u.
     age       hr     hr_l     hr_u

   40.00     3.04     1.14     8.14
   45.00     2.61     1.10     6.22
   50.00     2.24     1.06     4.76
   55.00     1.93     1.02     3.65
   60.00     1.66      .97     2.81
   65.00     1.42      .93     2.19
   70.00     1.22      .87     1.72
   75.00     1.05      .79     1.39
   80.00      .90      .69     1.18
   85.00      .77      .57     1.06
   90.00      .67      .45      .98
Table 4.15 on page 119 using the gbcs dataset.
get file ='C:Dataasa2gbcs.sav'.

coxreg rectime
/status=censrec(1)
/method = enter hormone
/method = enter hormone nodes
/method = enter hormone nodes hormone*nodes.
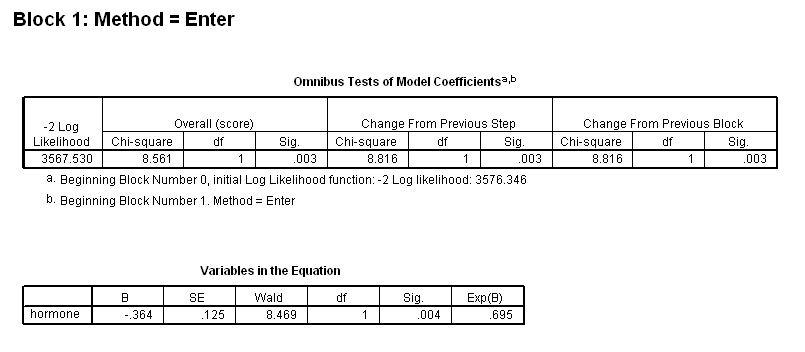
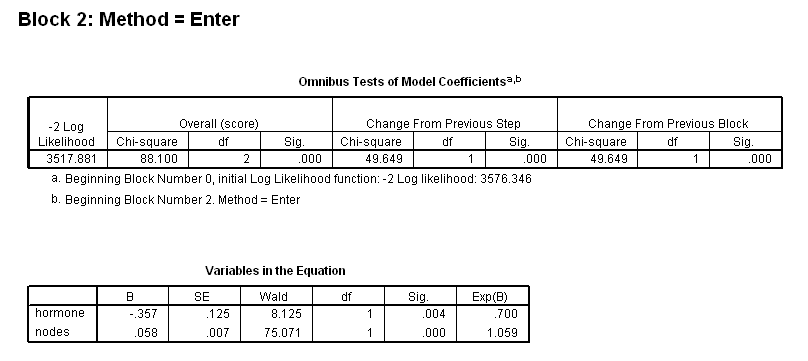
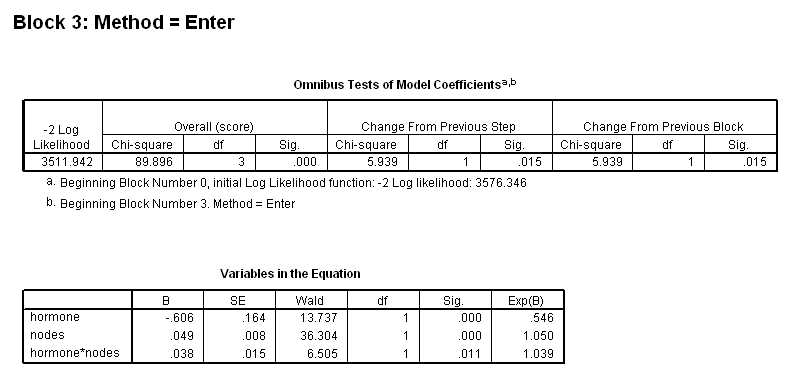
Figure 4.4 and Table 4.16 on page 120 using the gbcs dataset.
get file ='C:Dataasa2gbcs.sav'.
compute hormonexnodes = (hormone-1)*nodes.
exe.
coxreg rectime with nodes hormone  hormonexnodes
/status=censrec(1)
/method = enter hormone nodes hormonexnodes
/print = corr.

data list free
/nodes.
begin data
0 1 3 5 7 9 10 15 20 25 30 35 40 45 50
end data.

*Creating the variance and covariance matrix.
compute #vn    = .008**2.
compute #vh    = .164**2.
compute #vhxn = .015**2.

compute #cov_n_h     = .291*sqrt((#vn)*(#vh)).
compute #cov_n_hxn  =-.529*sqrt((#vn)*(#vhxn)).
compute #cov_h_hxn  =-.643*sqrt((#vh)*(#vhxn)).

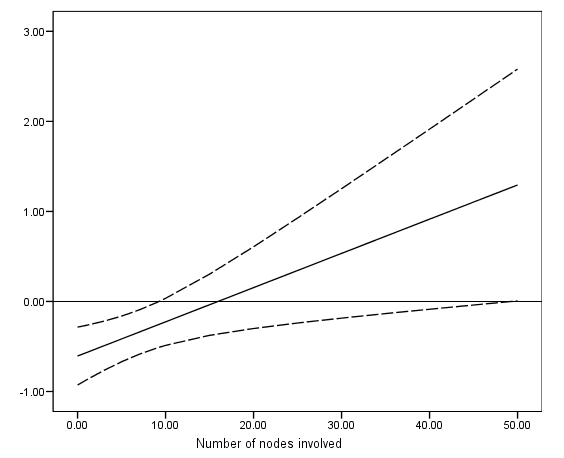
compute log_hr = -.606 + nodes*(.038).
compute se = sqrt(#vh + nodes**2*(#vhxn) + 2*nodes*#cov_h_hxn).
compute log_hr_l  = log_hr - 1.96*se.
compute log_hr_u = log_hr + 1.96*se.
exe.

graph
/scatterplot(overlay) = nodes nodes nodes with log_hr log_hr_l log_hr_u (pair).
compute hr=exp(log_hr).
compute cie_l = exp(log_hr_l).
compute cie_u = exp(log_hr_u).
exe.
list nodes hr cie_l cie_u
/ cases =to 6.
   nodes       hr    cie_l    cie_u

     .00      .55      .40      .75
    1.00      .57      .42      .77
    3.00      .61      .47      .80
    5.00      .66      .51      .85
    7.00      .71      .56      .91
    9.00      .77      .60      .99
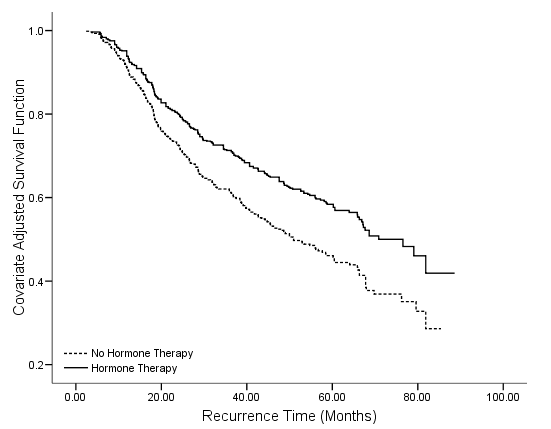
Table 4.17 on page 121 and Figure 4.5 on page 123 using the gbcs dataset.
get file='D:workdatabooksasa2gbcs.sav'.
compute time = rectime/30.
recode hormone (1=0) (2=1).
exe.
coxreg time with hormone
/status=censrec(1)
/save survival(survival).
graph /scatterplot(bivar) = time with survival by hormone.
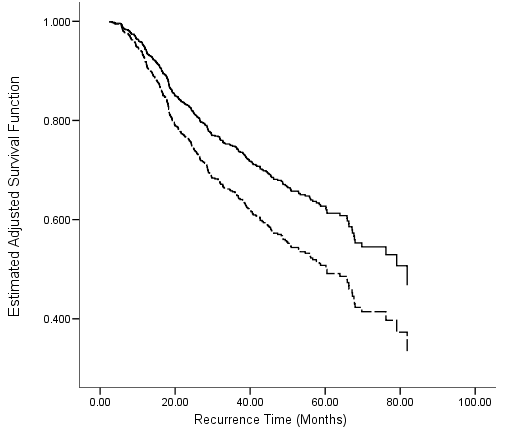
Table 4.18 on page 124 and Figure 4.6 on page 125 using the gbcs dataset.
get file ='C:Dataasa2gbcs.sav'.
compute size_c=size-25.
compute months=rectime/30.
exe.
oms select tables
/if subtypes='Survival Table'
/destination format=sav
outfile = 'c:dataasa2fig4_6.sav'.
coxreg months with  hormone  size_c
/status=censrec(1)
/method = enter hormone  size_c
/print = baseline.
omsend.
get file ='C:Dataasa2fig4_6.sav'.
compute s_h = survival**(exp(-.373)).
exe.
graph /scatterplot(overlay)=Var1 Var1 with survival s_h (pair).
Table 4.19, Figure 4.7 on page 127 and Figure 4.8 on page 128 using the gbcs dataset.
get file ='C:Dataasa2gbcs.sav'.
compute months=rectime/30.
compute ln_prg = ln(prog_recp+1).
exe.
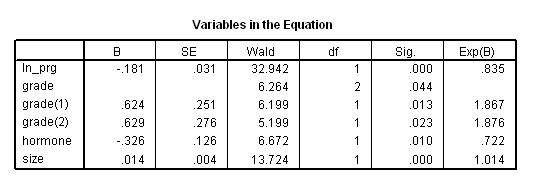
coxreg months with ln_prg grade hormone size
/status=censrec(1)
/categorical = grade
/contrast (grade) = indicator(1)
/method = enter grade ln_prg hormone size.
coxreg months with ln_prg grade hormone size /status=censrec(1) /categorical = grade /contrast (grade) = indicator(1) /method = enter grade ln_prg hormone size /save xbeta(xb) Hazard(H). * computing the baseline survival function. compute base_s = exp(-H/exp(xb)). examine variable = xb /percentiles(10,25,50,75,90) .compute s10 = base_s**(exp(-.7327497)). compute s25 = base_s**(exp(-.3457095)). compute s50 = base_s**(exp(.0150510)). compute s75 = base_s**(exp(.3671402)). compute s90 = base_s**(exp(.6788465)). exe. graph /scatterplot(overlay)=months months months months months with s10 s25 s50 s75 s90 (pair).
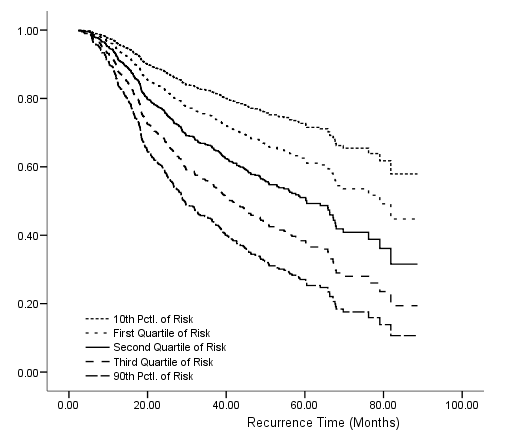
compute rm = xbeta-(-0.32588)*hormone.
compute s0 = base_s**exp(0.3428946).
compute s1 = base_s**exp(0.3428946+(-0.32588)).
exe.
graph /scatterplot(overlay)=months months
       with s0 s1 (pair).
