Page 386 Table 16.2
get file 'c:cama3companies.sav'.
descriptives var = ror5 de salesgr5 npm1 payoutr1
 /save.
list symbol obsno zror5 zde zsalesgr znpm1 zpayoutr.
  dia   1.00   .96293   -.00736   .42907   .27749    1.28929   -.23733   .15057
  dow   2.00   .96293   -.00736   .05048  -.05684    1.33381   -.44192  -.21655
  stf   3.00   .96293   -.55933  -.29025   .22973    1.60093   -.44192  -.00701
  dd    4.00   .66060   -.92731  -.49216  -.24788     .48794   -.23733  1.28945
  uk    5.00  -.17082   -.55933  -.40383  -.61803    1.06669   -1.05570 -.66757
  psm   6.00  -.24640   -.37534  -.59312   .15809    -.22438    -.85111   .82860
  gra   7.00  -.20861   -.37534  -.83289  -.73743     .22082    -.03273  -.23085
  hpc   8.00  -.05744   -.74332  -.68146  -.53445     .08726    -.23733   .59662
  mtc   9.00  -.35978   -.55933  -.41645  -.86878    -.35794     .17186  1.33015
  acy  10.00  -.20861   -.55933  -.59312 -1.07176     .13178    -.23733   .66787
  cz   11.00  -.96444   -.55933  -.75718   .33719    -.40246    -.64652   .65447
  ald  12.00  -1.19119  -.19135  -.17667  -.98818     .35438    -.64652 -1.08741
  rom  13.00  -1.00224  -.55933  -.73194 -1.21505     .57698    -.64652  -.73904
  rei  14.00  -1.49353  -.55933   .23977  -1.94341  -1.33737    -.03273  -.18999
  hum  15.00   -.47315  3.67244  2.90251   2.53422    .66601    2.21779  -.13474
  hca  16.00   -.58653   .36062  1.38816   1.23272   1.06669    2.42239 -1.97891
  nme  17.00   -.77549   .91259  2.76370   1.36406    .26534    1.80861  -.84038
  ami  18.00   -.54874   .72860   .66884   1.04167    .75505    1.80861  -.83807
  ahs  19.00    .92514  -.74332  -.10096    .36108    .62149     .78564  -.96513
  lks  20.00   1.79435  -.00736  -.18929   -.18818  -1.24833    -.44192  1.53644
  win  21.00   3.00368  -.92731  -.22715   -.18818  -1.20381    -.23733  1.37083
  sgl  22.00   -.20861  1.64855  -.90861   1.32824  -1.47093    -.85111 -1.70857
  slc  23.00   -.20861   .72860   .13882    .25361  -1.20381    -.44192  -.69548
  kr   24.00   -.09524  -.37534  -.53002    .57600  -1.51545    -.85111   .37012
  sa   25.00   -.47315   .54461  -.65622  -1.03594  -1.55997    -.64652  1.50460

Number of cases read:  25    Number of cases listed:  25
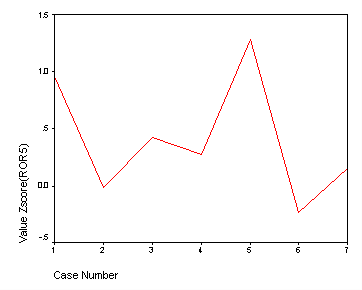
Page 387 Figure 16.3
varstocases
 /make xaxis from zror5 zde zsalesgr zeps5 znpm1 zpe zpayoutr.
use 1 thru 7.
graph
 /line(simple)=value(xaxis).

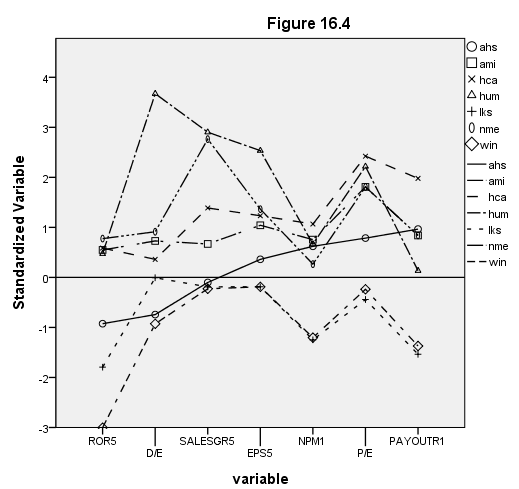
Page 388 Figure 16.4
NOTE: The execute command after the compute command is necessary for the filter to work correctly.
get file 'c:cama3companies.sav'.
descriptives var = ror5 de salesgr5 eps5 npm1 pe payoutr1
 /save.
compute zror51 = -zror5.
compute zpay1 = -zpayoutr.
varstocases
 /make yaxis from zror51 zde zsalesgr zeps5 znpm1 zpe zpay1
 /index = variable.
compute filter = (obsno ge 15 and obsno le 21).
exe.
filter by filter.

value labels variable 1 "ROR5" 2 "D/E" 3 "SALESGR5" 4 "EPS5" 5 "NPM1" 6 "P/E" 7 "PAYOUTR1".
formats yaxis (f2.0) .
GGRAPH
  /GRAPHDATASET NAME="GraphDataset" VARIABLES= yaxis variable symbol
  /GRAPHSPEC SOURCE=INLINE .
BEGIN GPL
SOURCE: s=userSource( id( "GraphDataset" ) )
DATA: yaxis=col( source(s), name( "yaxis" ) )
DATA: variable=col( source(s), name( "variable" ), unit.category() )
DATA: symbol=col( source(s), name( "symbol" ), unit.category() )
GUIDE: text.title( label( "Figure 16.4" ) )
GUIDE: axis( dim( 1 ), label( "variable" ) )
GUIDE: axis( dim( 2 ), label( "Standardized Variable" ) )
GUIDE: form.line(position(*, 0))
SCALE: linear( dim( 2 ), min(-3), max(4) )
ELEMENT: point( position(summary.mean( variable * yaxis)) ), shape(symbol))
ELEMENT: line( position(summary.mean( variable * yaxis)) ), shape(symbol))
END GPL.
filter off.

Page 399 Figure 16.9
get file 'c:cama3companies.sav'.
descriptives var = ror5 de salesgr5 eps5 npm1 pe payoutr1
 /save.
cluster zror5 zde zsalesgr zeps5 znpm1 zpe zpayoutr
 /measure = seuclid
 /method = centroid
 /plot = dendrogram.
* * * * * * H I E R A R C H I C A L C L U S T E R A N A L Y S I S * * * * * *
Dendrogram using Centroid Method
Rescaled Distance Cluster Combine
C A S E 0 5 10 15 20 25
Label Num +———+———+———+———+———+
8
10
7
9
6
11
4
12
13
5
1
2
3
19
23
24
25
14
20
21
22
16
18
17
15
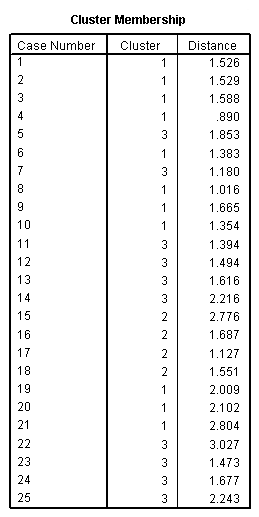
Page 401 Table 16.4
quick cluster zror5 zde zsalesgr zeps5 znpm1 zpe zpayoutr
 /criteria = cluster (3)
 /method = kmeans(noupdate)
 /print initial cluster distan.
<some output omitted>

Page 403 Figure 16.10
NOTE: This graph has been skipped for now.
