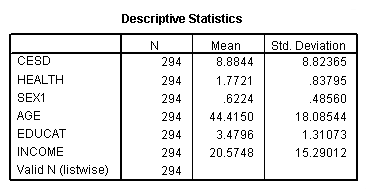
Page 235 Table 10.1 Means and standard deviations for depression data set.
get file 'c:cama4depress.sav'.
compute sex1 = sex - 1.
descriptives variables = cesd health sex1 age educat income
 /statistics = mean stddev.
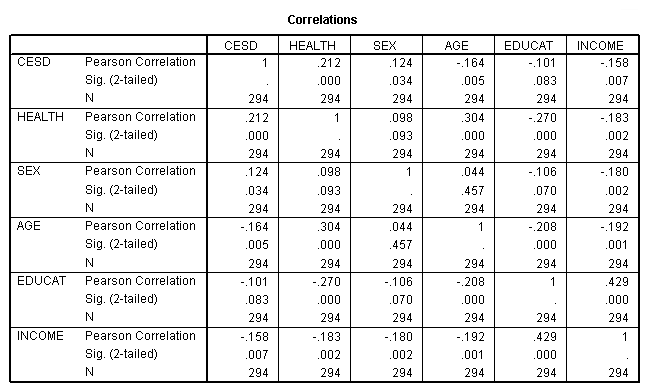
Page 235 Table 10.2 Correlation matrix for depression data set.
correlate variables = cesd health sex age educat income.
Page 237 Table 10.3 Canonical correlation coefficients for first correlation (depression data set)
manova cesd health with sex age educat income
 /discrim.
<some output omitted>
 - - - - - - - - - - - - - - - - - - - - - - - - - - - - - - - - - - - - -
 Raw canonical coefficients for DEPENDENT variables
           Function No.

 Variable            1          2

 CESD            -.055       .102
 HEALTH          1.172       .344

 - - - - - - - - - - - - - - - - - - - - - - - - - - - - - - - - - - - - -
 Raw canonical coefficients for COVARIATES
           Function No.

 COVARIATE           1          2

 SEX              .051       .816
 AGE              .048      -.024
 EDUCAT          -.292      -.342
 INCOME           .005      -.036

 - - - - - - - - - - - - - - - - - - - - - - - - - - - - - - - - - - - - -
 Standardized canonical coefficients for COVARIATES
           CAN. VAR.

 COVARIATE           1          2

 SEX              .025       .396
 AGE              .871      -.443
 EDUCAT          -.383      -.448
 INCOME           .082      -.555

 - - - - - - - - - - - - - - - - - - - - - - - - - - - - - - - - - - - - -
Page 238 Table 10.4 Computation of correlation between U(1) and V(1)
These computations are based on the previous two tables.
Page 239 The second canonical correlations give at the top of the page.
NOTE: This output is part of the output given by the code above.
- - - - - - - - - - - - - - - - - - - - - - - - - - - - - - - - - - - - -
 Standardized canonical coefficients for DEPENDENT variables
           Function No.

 Variable            1          2

 CESD            -.490       .899
 HEALTH           .982       .288
- - - - - - - - - - - - - - - - - - - - - - - - - - - - - - - - - - - - -
 Standardized canonical coefficients for COVARIATES
           CAN. VAR.

 COVARIATE           1          2

 SEX              .025       .396
 AGE              .871      -.443
 EDUCAT          -.383      -.448
 INCOME           .082      -.555

 - - - - - - - - - - - - - - - - - - - - - - - - - - - - - - - - - - - - -
Page 241 Figure 10.1 Plot of 294 pairs of the canonical variables U(1) and V(1) for the depression data set (canonical correlation = 0.405)
NOTE: We were unable to reproduce this graph.
Page 242 Table 10.5 Correlations between canonical variables and corresponding variables (depression data set)
NOTE: This output is part of that produced by the manova command above.
* * * * * * A n a l y s i s   o f   V a r i a n c e -- design   1 * * * * * *

 Correlations between DEPENDENT and canonical variables
           Function No.

 Variable            1          2

 CESD            -.281       .960
 HEALTH           .878       .478

 - - - - - - - - - - - - - - - - - - - - - - - - - - - - - - - - - - - - -
 Correlations between COVARIATES and canonical variables
           CAN. VAR.

 Covariate           1          2

 SEX              .089       .525
 AGE              .936      -.225
 EDUCAT          -.532      -.636
 INCOME          -.254      -.734
- - - - - - - - - - - - - - - - - - - - - - - - - - - - - - - - - - - - -