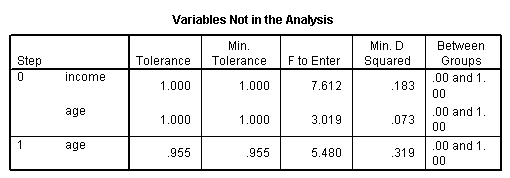
Page 252 Table 11.1 Means and standard deviations for nondepressed and depressed adults in Los Angeles County
NOTE: After getting the data file, you need to sort the data file by the variable cases. Next, you need to split the file by cases so that you can get the means and standard deviations for those coded as normal and depressed. The temporary command is used before the split file command so that the data file is not split permanently, but rather split only while the next command, in this case, the descriptives command, is run.
get file 'c:cama4depress.sav'.

sort cases by cases.
temporary.
split file by cases.

descriptives variables = sex age educat income health beddays acuteill chronill
 /stat = mean stddev.
Page 254 Figure 11.2 Distribution of income for depressed and nondepressed individuals showing effects of a dividing point at an income of $18440
NOTE: We were unable to reproduce this graph.
Page 255 Table 11.2 Classification of individuals as depressed or not depressed on the basis of income alone
discriminant groups = cases (0,1)
 /variables = income
 /statistics = table.
<some output omitted>
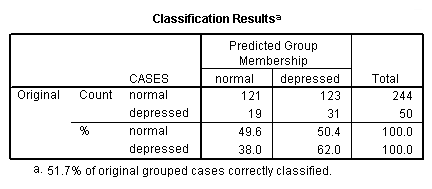
Page 258 Figure 11.5 Classification of individuals as depressed or not depressed on the basis of income and age
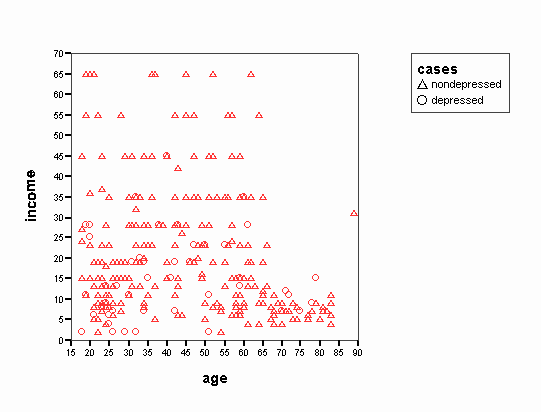
Page 259 Table 11.3 Classification of individuals as depressed or not depressed on the basis of income and age
<some output omitted>
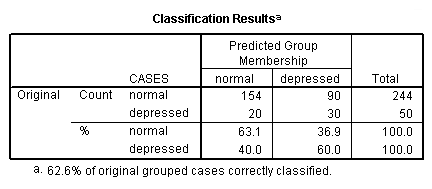
Page 263 Table 11.4 Classification function and discriminant coefficients for age and income
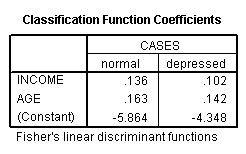
NOTE: We were unable to get the discriminant functions shown in the right-hand column of the table.
Page 263 The covariances at the bottom of the page
regression
 /dependent cases
 /method = enter age income
 /descriptives cov.

Page 270 middle of the page
NOTE: We have included only the relevant table in the output.
discriminant groups = cases(0,1)
 /variables = income age
 /method=mahal
 /statistics = mean.

Page 271 top of the page
discriminant groups = cases(0,1)
 /variables = income age
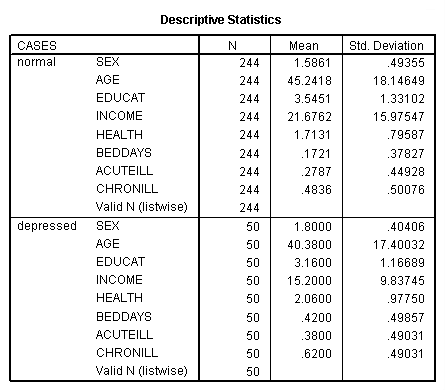
 /method=mahal
 /statistics = mean fpair.
