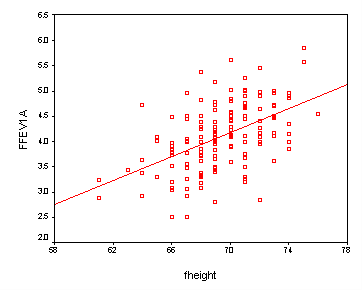
Page 87 Figure 6.1 Scatter diagram and regression line of FEV1 versus
height for fathers in lung function data.NOTE: Throughout this chapter
and the next, the variables FFEV1 and MFEV1 have been divided by
100 before use in analyses. We have named these modified variables
FFEV1a and MFEV1a, respectively.
get file 'c:cama4lung.sav'.

compute ffev1a = ffev1/100.
execute.

graph
 /scatterplot(bivar) fheight with ffev1a.
NOTE: To modify the labeling of the axes, double click on the graph to
open the Chart Editor and then double click on the axis. To add the
regression line, select Chart, Options and check on Total under Fit Line.
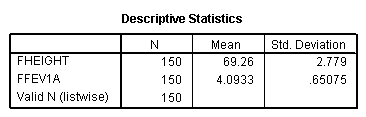
Page 88 The descriptive statistics at the top of the page
descriptives variables = fheight ffev1a
 /statistics = mean stddev.
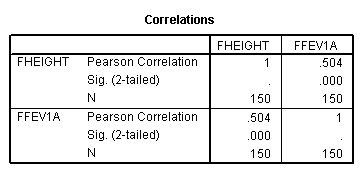
Page 98 The correlation in the middle of the page
correlations
 /variables = fheight ffev1a.
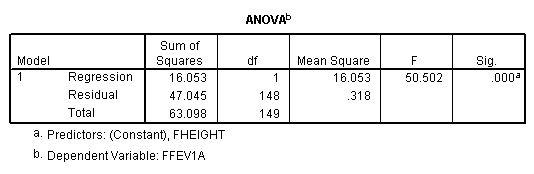
Page 100 Table 6.2 ANOVA example from Figure 6.1
NOTE: We need to save the residuals for use in the next figure.
regression
 /dependent ffev1a
 /method = enter fheight
 /save resid (resid).
<some output omitted>
Page 112 Figure 6.10 This has been skipped for now.
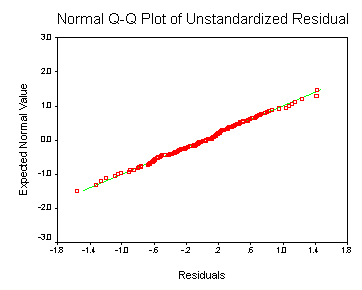
Page 116 Figure 6.12 Normal probability plot of the residuals of the
regression of FEV1 on height for fathers in the lung function data.
pplot
 /variables = resid
 /type = q-q.