Table 12.1, page 323. Financial Ratios of Solvent and Bankrupt Firms (First
10 observations).
get file 'd:p323.sav'.
compute index = $casenum.
exe.
list
 /cases = 10.
       y        x1        x2        x3    index

       0    -62.80    -89.50      1.70     1.00
       0      3.30     -3.50      1.10     2.00
       0   -120.80   -103.20      2.50     3.00
       0    -18.10    -28.80      1.10     4.00
       0     -3.80    -50.60       .90     5.00
       0    -61.20    -56.20      1.70     6.00
       0    -20.30    -17.40      1.00     7.00
       0   -194.50    -25.80       .50     8.00
       0     20.80     -4.30      1.00     9.00
       0   -106.10    -22.90      1.50    10.00

Number of cases read:  10    Number of cases listed:  10
Table 12.2, page 324.
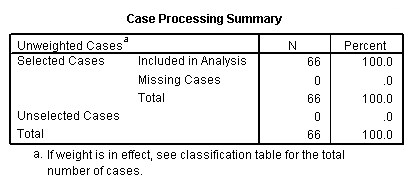
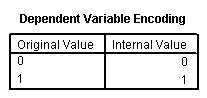
logistic regression y
 /method = enter x1 x2 x3
 /print = summary ci(.95)
 /save dev(dr) cook(c).
Block 0: Beginning Block
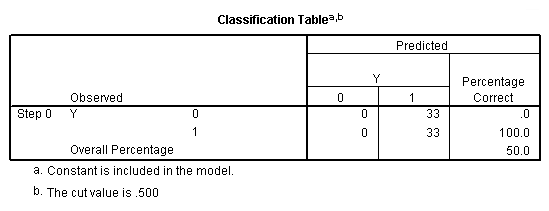

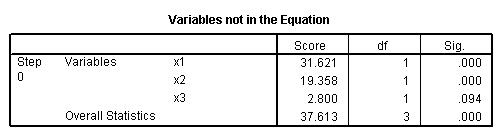
Block 1: Method = Enter
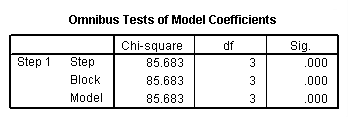
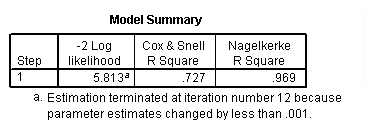
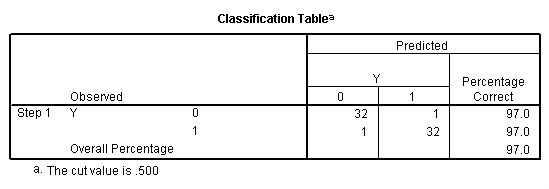
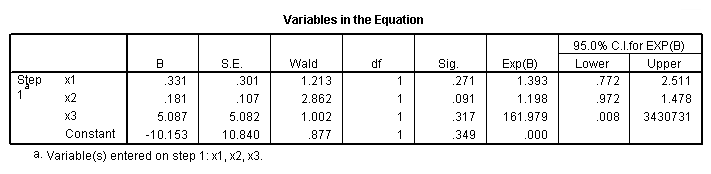
Figure 12.2, page 326.
NOTE: Figure is different than what is presented in the book.
graph
 /scatterplot = index with dr.
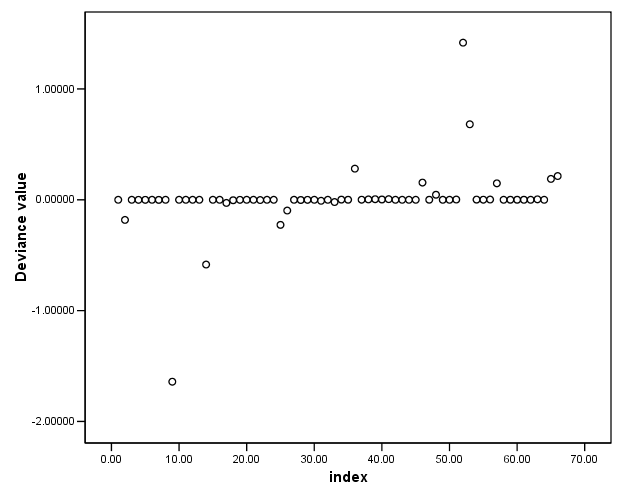
Figure 12.3, page 326.
NOTE: Figure is different than what is presented in the book.
graph
 /scatterplot = index with c.
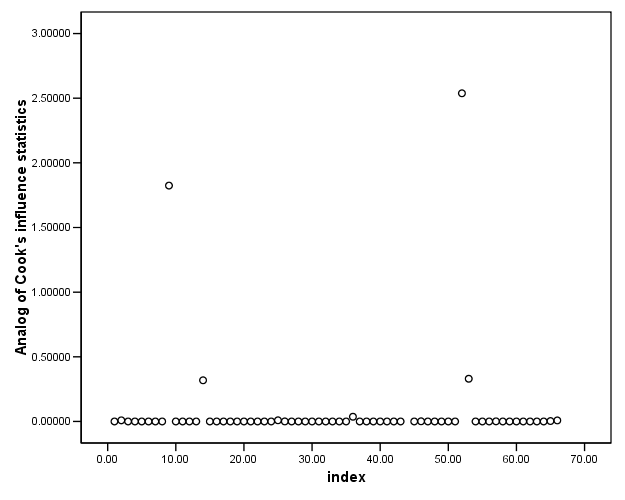
Figure 12.4, page 327.
NOTE: SPSS does not have the influential measurement DG, change in the
chi-squared test statistics G when the ith observation is deleted.
Table 12.3, page 328. Output From the Logistic Regression Using x1 and x2.
logistic regression y
 /method = enter x1 x2
 /print = summary ci(.95).
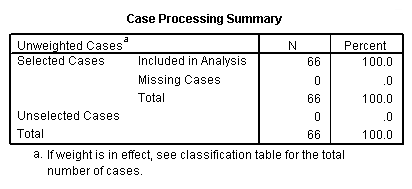
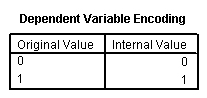
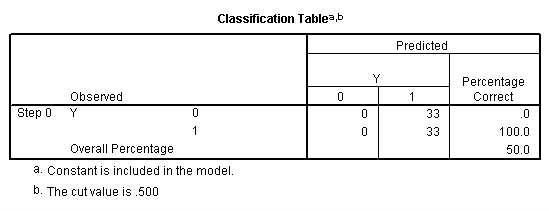
Block 0: Beginning Block

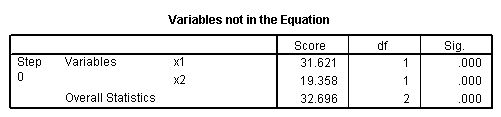
Block 1: Method = Enter
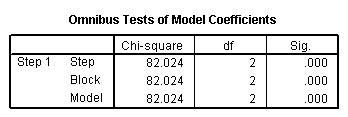
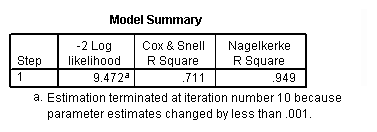
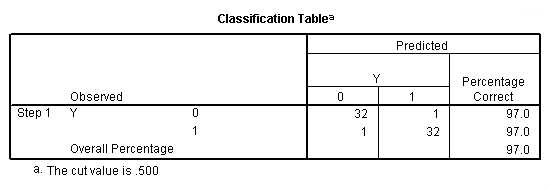
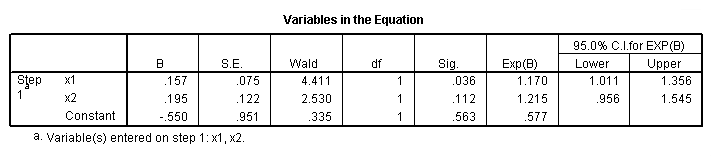
Table 12.4, page 328. Output from the logistic regression using x1.
logistic regression y
 /method = enter x1
 /print = summary ci(.95).
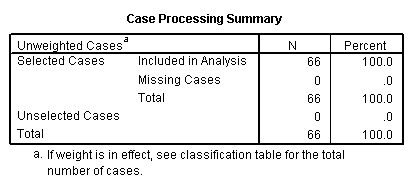
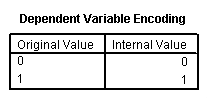
Block 0: Beginning Block
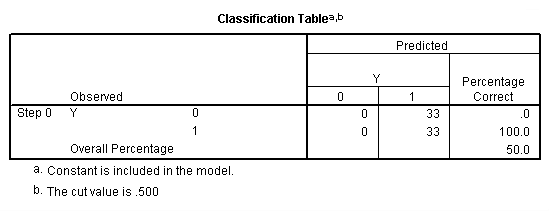


Block 1: Method = Enter
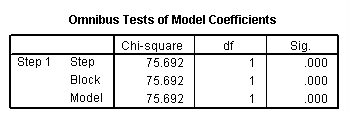
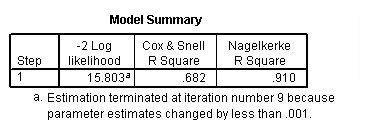
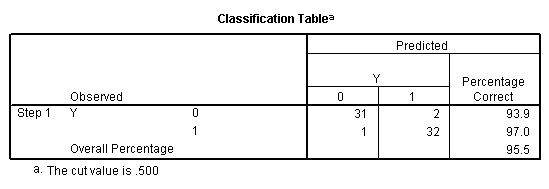

Table 12.5, page 331. Results from OLS Regression of Y on x1, x2 and x3.
regression
 /dependent = y
 /method enter = x1 x2 x3
 /save pred(p).
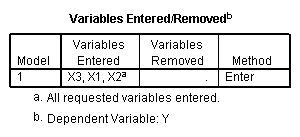
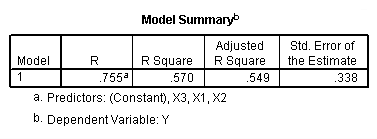
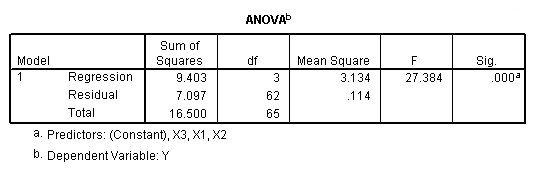
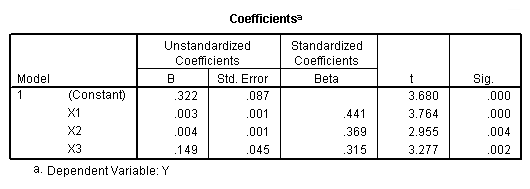
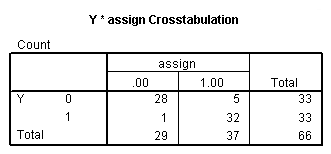
Table 12.6, page 332. Classification of Observations by Fitted Values.
compute assign = (p >= .5).
exe.
list y p assign
 /cases =10.
       y           p   assign

       0     -.00170      .00
       0      .48066      .00
       0     -.12212      .00
       0      .30644      .00
       0      .22883      .00
       0      .14467      .00
       0      .33313      .00
       0     -.32057      .00
       0      .51704     1.00
       0      .11620      .00

Number of cases read:  10    Number of cases listed:  10
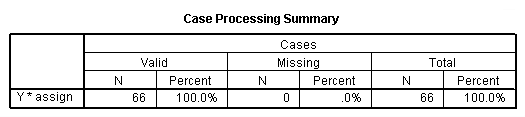
crosstabs
 /tables = y by assign.