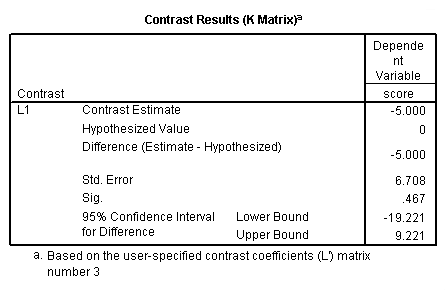
Data from Chapter 5 from Table 5.1, page 90.
data list list/ time score.
begin data.
0 4
0 6
0 10
0 9
0 11
20 18
20 13
20 15
20 11
20 13
40 24
40 19
40 21
40 16
40 15
60 16
60 17
60 13
60 23
60 21
end data.
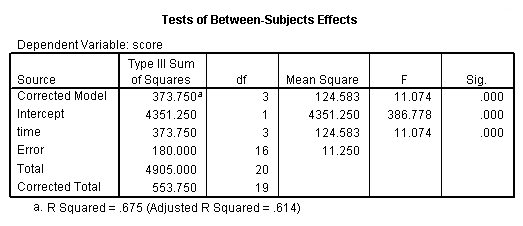
Table 5.1 page 90. One-way Analysis of Variance.
oneway score by time.

Evaluating Linear, Quadratic and Cubic trend in a one-way design, page 92-100.
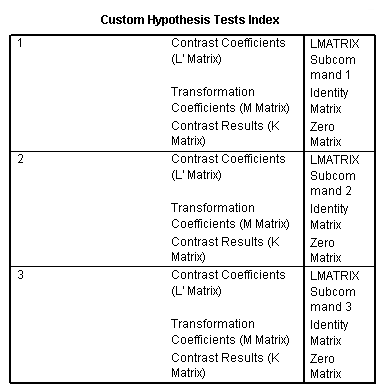
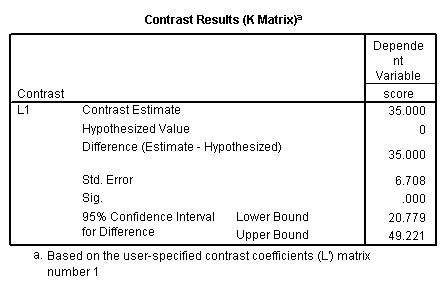
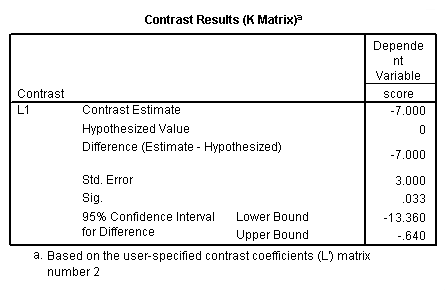
glm score by time
 /lmatrix time -3 -1 1 3
 /lmatrix time 1 -1 -1 1
 /lmatrix time -1 3 -3 1.
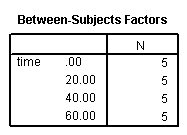
Custom Hypothesis Tests #1

Custom Hypothesis Tests #2

Custom Hypothesis Tests #3
