Page 369 Table 14.2 Principal components analysis for standardized CESD scale items (depression data set)
NOTE: We were unable to reproduce this table.
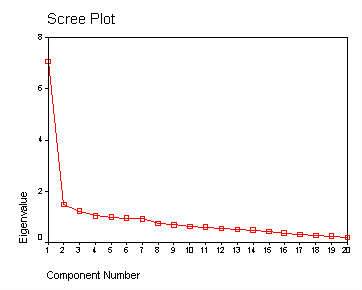
Page 368 Figure 14.5 Eigenvalues and cumulative percentages of total variance for depression data
Panel A:
NOTE: We were unable to reproduce this graph.
Panel B:
get file 'c:\pma5\depress.sav'.
factor variables = c1 to c20
 /plot = eigen.

