–>
SPSS Textbook Examples
Regression with Graphics by Lawrence Hamilton
Chapter 3: Basics of multiple regression
Page 68 Table 3.1 Regression of postshortage (1981) water use on income and preshortage (1980) water use.
GET FILE 'd:rwgdataconcord1.sav'.

REGRESSION
  /DEPENDENT water81
  /METHOD=ENTER income water80.
Variables Entered/Removed(b) Model Variables Entered Variables Removed Method 1 Summer 1980 Water Use, Income in Thousands(a) . Enter a All requested variables entered. b Dependent Variable: Summer 1981 Water Use
Model Summary Model R R Square Adjusted R Square Std. Error of the Estimate 1 .783(a) .614 .612 925.428 a Predictors: (Constant), Summer 1980 Water Use, Income in Thousands
ANOVA(b) Model Sum of Squares df Mean Square F Sig. 1 Regression 671025350.237 2 335512675.119 391.763 .000(a) Residual 422213359.440 493 856416.551 Total 1093238709.677 495 a Predictors: (Constant), Summer 1980 Water Use, Income in Thousands b Dependent Variable: Summer 1981 Water Use
Coefficients(a) Unstandardized Coefficients Standardized Coefficients t Sig. Model B Std. Error Beta 1 (Constant) 203.822 94.361 2.160 .031 Income in Thousands 20.545 3.383 .181 6.072 .000 Summer 1980 Water Use .593 .025 .704 23.679 .000 a Dependent Variable: Summer 1981 Water Use
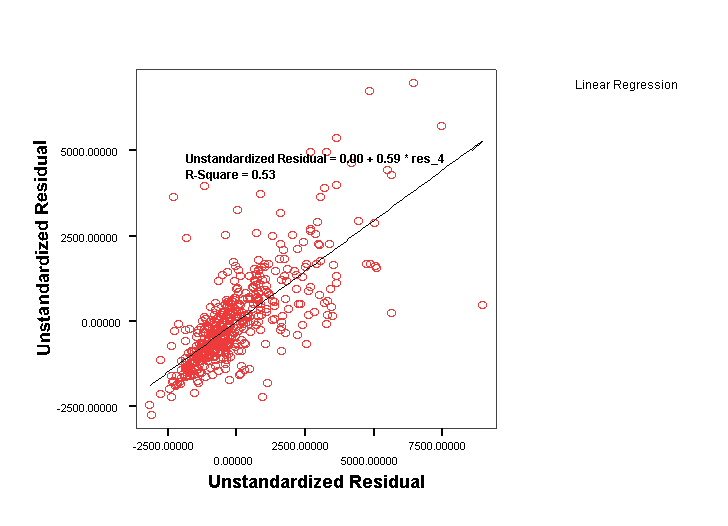
Page 70 Figure 3.1 Partial regression leverage plot:
postshortage water use (Y) versus income (1), adjusting for preshortage water use (2).
REGRESSION
/DEPENDENT water81
/METHOD=ENTER water80
/SAVE RESID.
Variables Entered/Removed(b) Model Variables Entered Variables Removed Method 1 Summer 1980 Water Use(a) . Enter a All requested variables entered. b Dependent Variable: Summer 1981 Water Use
Model Summary(b) Model R R Square Adjusted R Square Std. Error of the Estimate 1 .765(a) .585 .584 958.440 a Predictors: (Constant), Summer 1980 Water Use b Dependent Variable: Summer 1981 Water Use
ANOVA(b) Model Sum of Squares df Mean Square F Sig. 1 Regression 639446986.677 1 639446986.677 696.105 .000(a) Residual 453791723.000 494 918606.727 Total 1093238709.677 495 a Predictors: (Constant), Summer 1980 Water Use b Dependent Variable: Summer 1981 Water Use
Coefficients(a) Unstandardized Coefficients Standardized Coefficients t Sig. Model B Std. Error Beta 1 (Constant) 537.871 79.401 6.774 .000 Summer 1980 Water Use .644 .024 .765 26.384 .000 a Dependent Variable: Summer 1981 Water Use
Casewise Diagnostics(a) Case Number Std. Residual Summer 1981 Water Use 25 3.283 7100 79 3.318 8100 80 5.307 7300 85 5.548 6500 94 -5.135 3800 101 3.123 5400 118 4.992 7900 124 4.195 10100 125 4.802 9200 325 3.316 6100 362 -3.823 1900 a Dependent Variable: Summer 1981 Water Use
Residuals Statistics(a) Minimum Maximum Mean Std. Deviation N Predicted Value 666.75 8721.65 2298.39 1136.579 496 Residual -4921.65 5317.74 .00 957.471 496 Std. Predicted Value -1.436 5.651 .000 1.000 496 Std. Residual -5.135 5.548 .000 .999 496 a Dependent Variable: Summer 1981 Water Use REGRESSION /DEPENDENT income /METHOD=ENTER water80 /SAVE RESID.
Variables Entered/Removed(b) Model Variables Entered Variables Removed Method 1 Summer 1980 Water Use(a) . Enter a All requested variables entered. b Dependent Variable: Income in Thousands
Model Summary(b) Model R R Square Adjusted R Square Std. Error of the Estimate 1 .337(a) .114 .112 12.306 a Predictors: (Constant), Summer 1980 Water Use b Dependent Variable: Income in Thousands
ANOVA(b) Model Sum of Squares df Mean Square F Sig. 1 Regression 9588.317 1 9588.317 63.313 .000(a) Residual 74812.772 494 151.443 Total 84401.089 495 a Predictors: (Constant), Summer 1980 Water Use b Dependent Variable: Income in Thousands
Coefficients(a) Unstandardized Coefficients Standardized Coefficients t Sig. Model B Std. Error Beta 1 (Constant) 16.259 1.019 15.948 .000 Summer 1980 Water Use 2.495E-03 .000 .337 7.957 .000 a Dependent Variable: Income in Thousands
Casewise Diagnostics(a) Case Number Std. Residual Income in Thousands 65 3.921 72 118 5.181 90 125 5.527 100 281 3.170 68 a Dependent Variable: Income in Thousands
Residuals Statistics(a) Minimum Maximum Mean Std. Deviation N Predicted Value 16.76 47.95 23.08 4.401 496 Residual -25.72 68.02 .00 12.294 496 Std. Predicted Value -1.436 5.651 .000 1.000 496 Std. Residual -2.090 5.527 .000 .999 496 a Dependent Variable: Income in Thousands
IGRAPH
 /X1 = VAR(res_2)
 /Y = VAR(res_1)
 /FITLINE METHOD = REGRESSION LINEAR  LINE = TOTAL
 /SCATTER COINCIDENT = NONE.
Interactive Graph
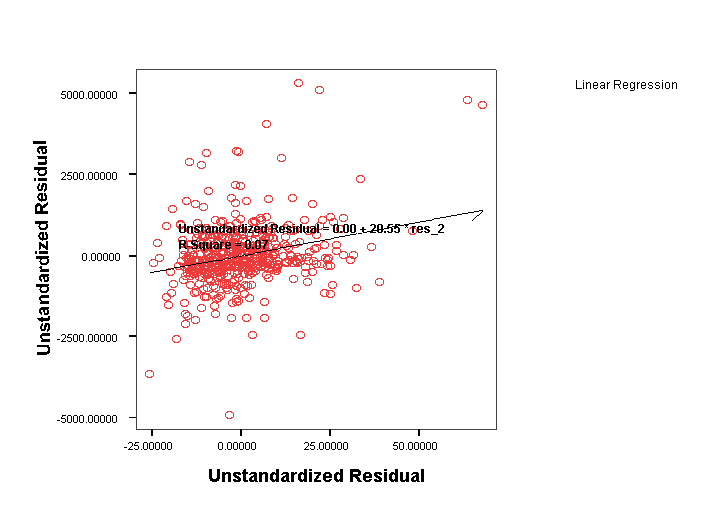
Page 71 Figure 3.2 Partial regression leverage plot: postshortage water use (Y) versus preshortage water use (2), adjusting for income (1).
REGRESSION
/DEPENDENT water81
/METHOD=ENTER income
/SAVE RESID.
Variables Entered/Removed(b) Model Variables Entered Variables Removed Method 1 Income in Thousands(a) . Enter a All requested variables entered. b Dependent Variable: Summer 1981 Water Use
Model Summary(b) Model R R Square Adjusted R Square Std. Error of the Estimate 1 .418(a) .175 .173 1351.576 a Predictors: (Constant), Income in Thousands b Dependent Variable: Summer 1981 Water Use
ANOVA(b) Model Sum of Squares df Mean Square F Sig. 1 Regression 190820566.279 1 190820566.279 104.459 .000(a) Residual 902418143.398 494 1826757.375 Total 1093238709.677 495 a Predictors: (Constant), Income in Thousands b Dependent Variable: Summer 1981 Water Use
Coefficients(a) Unstandardized Coefficients Standardized Coefficients t Sig. Model B Std. Error Beta 1 (Constant) 1201.124 123.325 9.740 .000 Income in Thousands 47.549 4.652 .418 10.221 .000 a Dependent Variable: Summer 1981 Water Use
Casewise Diagnostics(a) Case Number Std. Residual Summer 1981 Water Use 25 3.661 7100 62 5.187 9400 68 3.429 7500 79 3.979 8100 108 3.661 7100 124 5.001 10100 194 3.277 7200 446 3.161 6900 451 4.225 8100 a Dependent Variable: Summer 1981 Water Use
Residuals Statistics(a) Minimum Maximum Mean Std. Deviation N Predicted Value 1296.22 5955.99 2298.39 620.883 496 Residual -2765.33 7010.16 .00 1350.210 496 Std. Predicted Value -1.614 5.891 .000 1.000 496 Std. Residual -2.046 5.187 .000 .999 496 a Dependent Variable: Summer 1981 Water Use REGRESSION /DEPENDENT water80 /METHOD=ENTER income /SAVE RESID.
Variables Entered/Removed(b) Model Variables Entered Variables Removed Method 1 Income in Thousands(a) . Enter a All requested variables entered. b Dependent Variable: Summer 1980 Water Use
Model Summary(b) Model R R Square Adjusted R Square Std. Error of the Estimate 1 .337(a) .114 .112 1662.273 a Predictors: (Constant), Income in Thousands b Dependent Variable: Summer 1980 Water Use
ANOVA(b) Model Sum of Squares df Mean Square F Sig. 1 Regression 174943659.340 1 174943659.340 63.313 .000(a) Residual 1364996643.080 494 2763151.099 Total 1539940302.419 495 a Predictors: (Constant), Income in Thousands b Dependent Variable: Summer 1980 Water Use
Coefficients(a) Unstandardized Coefficients Standardized Coefficients t Sig. Model B Std. Error Beta 1 (Constant) 1681.433 151.674 11.086 .000 Income in Thousands 45.528 5.722 .337 7.957 .000 a Dependent Variable: Summer 1980 Water Use
Casewise Diagnostics(a) Case Number Std. Residual Summer 1980 Water Use 62 3.899 9300 94 5.396 12700 155 3.029 7400 194 3.318 8700 362 3.407 7800 446 3.401 8700 451 4.500 10300 477 3.073 7700 482 3.056 7900 a Dependent Variable: Summer 1980 Water Use
Residuals Statistics(a) Minimum Maximum Mean Std. Deviation N Predicted Value 1772.49 6234.20 2732.06 594.493 496 Residual -3157.81 8969.82 .00 1660.593 496 Std. Predicted Value -1.614 5.891 .000 1.000 496 Std. Residual -1.900 5.396 .000 .999 496 a Dependent Variable: Summer 1980 Water Use
IGRAPH
 /X1 = VAR(res_4)
 /Y = VAR(res_3)
 /FITLINE METHOD = REGRESSION LINEAR  LINE = TOTAL
 /SCATTER COINCIDENT = NONE.
Page 74 Table 3.2 Regression of postshortage water use on income, preshortage water use, education, retirement, number of people in resident, and increase in people in resident.
REGRESSION
/DEPENDENT water81
/METHOD=ENTER income water80 educat retire peop81 cpeop.
| Model | Variables Entered | Variables Removed | Method |
|---|---|---|---|
| 1 | Increase in # of People, Education in Years, Summer 1980 Water Use, head of house retired?, Income in Thousands, # of People Resident, 1981(a) | . | Enter |
| a All requested variables entered. | |||
| b Dependent Variable: Summer 1981 Water Use | |||
| Model | R | R Square | Adjusted R Square | Std. Error of the Estimate |
|---|---|---|---|---|
| 1 | .823(a) | .677 | .673 | 849.349 |
| a Predictors: (Constant), Increase in # of People, Education in Years, Summer 1980 Water Use, head of house retired?, Income in Thousands, # of People Resident, 1981 | ||||
| Model | Sum of Squares | df | Mean Square | F | Sig. | |
|---|---|---|---|---|---|---|
| 1 | Regression | 740477522.059 | 6 | 123412920.343 | 171.076 | .000(a) |
| Residual | 352761187.618 | 489 | 721393.022 | |
|
|
| Total | 1093238709.677 | 495 | |
|
|
|
| a Predictors: (Constant), Increase in # of People, Education in Years, Summer 1980 Water Use, head of house retired?, Income in Thousands, # of People Resident, 1981 | ||||||
| b Dependent Variable: Summer 1981 Water Use | ||||||
| |
Unstandardized Coefficients | Standardized Coefficients | t | Sig. | ||
|---|---|---|---|---|---|---|
| Model | B | Std. Error | Beta | |||
| 1 | (Constant) | 242.220 | 206.864 | |
1.171 | .242 |
| Income in Thousands | 20.967 | 3.464 | .184 | 6.053 | .000 | |
| Summer 1980 Water Use | .492 | .026 | .584 | 18.671 | .000 | |
| Education in Years | -41.866 | 13.220 | -.087 | -3.167 | .002 | |
| head of house retired? | 189.184 | 95.021 | .058 | 1.991 | .047 | |
| # of People Resident, 1981 | 248.197 | 28.725 | .277 | 8.641 | .000 | |
| Increase in # of People | 96.454 | 80.519 | .031 | 1.198 | .232 | |
| a Dependent Variable: Summer 1981 Water Use | ||||||
Page 80 Table 3.3 Regression of postshortage water use omitting income and education .
REGRESSION
  /DEPENDENT water81
  /METHOD=ENTER water80 retire peop81 cpeop.
Regression
| Model | Variables Entered | Variables Removed | Method |
|---|---|---|---|
| 1 | Increase in # of People, Summer 1980 Water Use, head of house retired?, # of People Resident, 1981(a) | . | Enter |
| a All requested variables entered. | |||
| b Dependent Variable: Summer 1981 Water Use | |||
| Model | R | R Square | Adjusted R Square | Std. Error of the Estimate |
|---|---|---|---|---|
| 1 | .807(a) | .652 | .649 | 880.335 |
| a Predictors: (Constant), Increase in # of People, Summer 1980 Water Use, head of house retired?, # of People Resident, 1981 | ||||
| Model | Sum of Squares | df | Mean Square | F | Sig. | |
|---|---|---|---|---|---|---|
| 1 | Regression | 712718346.262 | 4 | 178179586.565 | 229.912 | .000(a) |
| Residual | 380520363.415 | 491 | 774990.557 | |
|
|
| Total | 1093238709.677 | 495 | |
|
|
|
| a Predictors: (Constant), Increase in # of People, Summer 1980 Water Use, head of house retired?, # of People Resident, 1981 | ||||||
| b Dependent Variable: Summer 1981 Water Use | ||||||
| |
Unstandardized Coefficients | Standardized Coefficients | t | Sig. | ||
|---|---|---|---|---|---|---|
| Model | B | Std. Error | Beta | |||
| 1 | (Constant) | 48.649 | 107.055 | |
.454 | .650 |
| Summer 1980 Water Use | .520 | .027 | .617 | 19.412 | .000 | |
| head of house retired? | 67.280 | 94.288 | .021 | .714 | .476 | |
| # of People Resident, 1981 | 265.289 | 29.632 | .296 | 8.953 | .000 | |
| Increase in # of People | 134.463 | 83.196 | .044 | 1.616 | .107 | |
| a Dependent Variable: Summer 1981 Water Use | ||||||
Intercept dummy variables
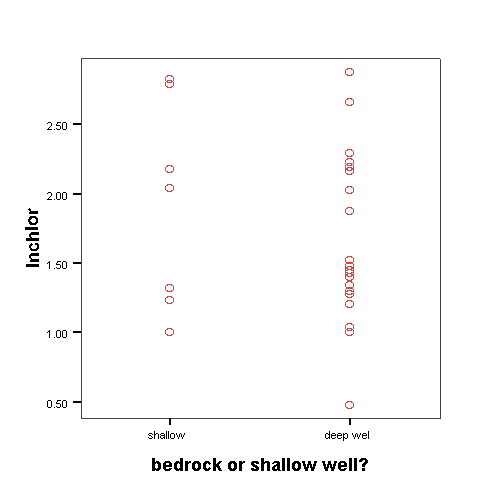
Page 87 Figure 3.3 Regression of log chloride concentration on a dummy variable for well type.
GET FILE 'd:appsrwgdatawells.sav'.

COMPUTE lnchlor = LG10(chlor).
EXECUTE.

REGRESSION
  /DEPENDENT lnchlor
  /METHOD=ENTER deep.
Regression
| Model | Variables Entered | Variables Removed | Method |
|---|---|---|---|
| 1 | bedrock or shallow well?(a) | . | Enter |
| a All requested variables entered. | |||
| b Dependent Variable: LNCHLOR | |||
| Model | R | R Square | Adjusted R Square | Std. Error of the Estimate |
|---|---|---|---|---|
| 1 | .205(a) | .042 | .023 | .58910 |
| a Predictors: (Constant), bedrock or shallow well? | ||||
| Model | Sum of Squares | df | Mean Square | F | Sig. | |
|---|---|---|---|---|---|---|
| 1 | Regression | .759 | 1 | .759 | 2.187 | .145(a) |
| Residual | 17.352 | 50 | .347 | |
|
|
| Total | 18.111 | 51 | |
|
|
|
| a Predictors: (Constant), bedrock or shallow well? | ||||||
| b Dependent Variable: LNCHLOR | ||||||
| |
Unstandardized Coefficients | Standardized Coefficients | t | Sig. | ||
|---|---|---|---|---|---|---|
| Model | B | Std. Error | Beta | |||
| 1 | (Constant) | 1.640 | .186 | |
8.801 | .000 |
| bedrock or shallow well? | -.307 | .207 | -.205 | -1.479 | .145 | |
| a Dependent Variable: LNCHLOR | ||||||
IGRAPH
 /X1 = VAR(deep)
 /Y = VAR(lnchlor)
 /FITLINE METHOD = REGRESSION LINEAR  LINE = TOTAL
 /SCATTER COINCIDENT = NONE.
Interactive Graph
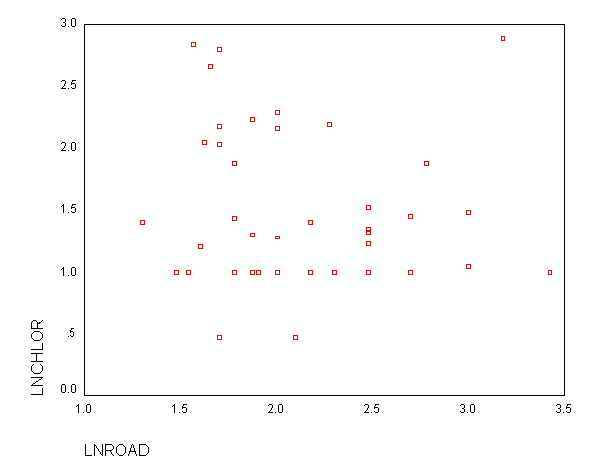
Page 88 Figure 3.4 Regression of log chloride concentration on log distance from road and an intercept dummy variable for well type.
COMPUTE LNROAD=LG10(DROAD).
EXECUTE.

REGRESSION
  /DEPENDENT lnchlor  /METHOD=ENTER lnroad
  /SAVE RESID.
Regression
| Model | Variables Entered | Variables Removed | Method |
|---|---|---|---|
| 1 | LNROAD(a) | . | Enter |
| a All requested variables entered. | |||
| b Dependent Variable: LNCHLOR | |||
| Model | R | R Square | Adjusted R Square | Std. Error of the Estimate |
|---|---|---|---|---|
| 1 | .078(a) | .006 | -.014 | .60002 |
| a Predictors: (Constant), LNROAD | ||||
| b Dependent Variable: LNCHLOR | ||||
| Model | Sum of Squares | df | Mean Square | F | Sig. | |
|---|---|---|---|---|---|---|
| 1 | Regression | .110 | 1 | .110 | .305 | .583(a) |
| Residual | 18.001 | 50 | .360 | |
|
|
| Total | 18.111 | 51 | |
|
|
|
| a Predictors: (Constant), LNROAD | ||||||
| b Dependent Variable: LNCHLOR | ||||||
| |
Unstandardized Coefficients | Standardized Coefficients | t | Sig. | ||
|---|---|---|---|---|---|---|
| Model | B | Std. Error | Beta | |||
| 1 | (Constant) | 1.603 | .392 | |
4.094 | .000 |
| LNROAD | -.100 | .182 | -.078 | -.552 | .583 | |
| a Dependent Variable: LNCHLOR | ||||||
| |
Minimum | Maximum | Mean | Std. Deviation | N |
|---|---|---|---|---|---|
| Predicted Value | 1.2602 | 1.4728 | 1.3919 | .04638 | 52 |
| Residual | -.9558 | 1.5960 | .0000 | .59411 | 52 |
| Std. Predicted Value | -2.840 | 1.743 | .000 | 1.000 | 52 |
| Std. Residual | -1.593 | 2.660 | .000 | .990 | 52 |
| a Dependent Variable: LNCHLOR | |||||
if deep=0 yhat0=res_1.
if deep=1 yhat1=res_1.
execute.

GRAPH
 /SCATTERPLOT(BIVAR)=lnroad WITH lnchlor.
Graph
Slope dummy variables
Page 89 Figure 3.5 Regression of log chloride concentration on log distance from road and a slope dummy variable for well type.
Compute deeproad=deep*lnroad.
Execute.

REGRESSION
 /DEPENDENT lnchlor
 /METHOD=ENTER lnroad deeproad
 /SAVE RESID.
Regression
| Model | Variables Entered | Variables Removed | Method |
|---|---|---|---|
| 1 | DEEPROAD, LNROAD(a) | . | Enter |
| a All requested variables entered. | |||
| b Dependent Variable: LNCHLOR | |||
| Model | R | R Square | Adjusted R Square | Std. Error of the Estimate |
|---|---|---|---|---|
| 1 | .140(a) | .019 | -.021 | .60200 |
| a Predictors: (Constant), DEEPROAD, LNROAD | ||||
| b Dependent Variable: LNCHLOR | ||||
| Model | Sum of Squares | df | Mean Square | F | Sig. | |
|---|---|---|---|---|---|---|
| 1 | Regression | .353 | 2 | .176 | .487 | .618(a) |
| Residual | 17.758 | 49 | .362 | |
|
|
| Total | 18.111 | 51 | |
|
|
|
| a Predictors: (Constant), DEEPROAD, LNROAD | ||||||
| b Dependent Variable: LNCHLOR | ||||||
| |
Unstandardized Coefficients | Standardized Coefficients | t | Sig. | ||
|---|---|---|---|---|---|---|
| Model | B | Std. Error | Beta | |||
| 1 | (Constant) | 1.592 | .393 | |
4.050 | .000 |
| LNROAD | -2.897E-02 | .202 | -.022 | -.144 | .886 | |
| DEEPROAD | -8.147E-02 | .099 | -.128 | -.819 | .417 | |
| a Dependent Variable: LNCHLOR | ||||||
| |
Minimum | Maximum | Mean | Std. Deviation | N |
|---|---|---|---|---|---|
| Predicted Value | 1.2143 | 1.5475 | 1.3919 | .08318 | 52 |
| Residual | -.9274 | 1.6394 | .0000 | .59008 | 52 |
| Std. Predicted Value | -2.135 | 1.870 | .000 | 1.000 | 52 |
| Std. Residual | -1.541 | 2.723 | .000 | .980 | 52 |
| a Dependent Variable: LNCHLOR | |||||
If deep=0 yhat20=res_2.
If deep=1 yhat10=res_2.
Execute.

GRAPH
  /SCATTERPLOT(BIVAR)=lnroad WITH lnchlor.
Graph
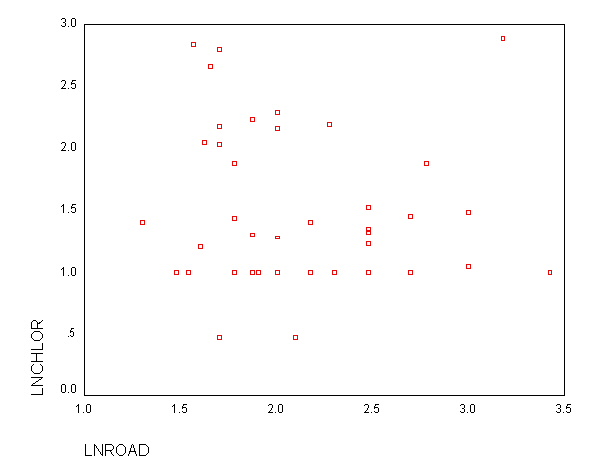
Page 90 Table 3.4 Regression of log chloride concentration on log distance from road, with intercept and slope dummy variables for well type.
REGRESSION
/DEPENDENT lnchlor
/METHOD=ENTER deep lnroad deeproad.
Regression
| Model | Variables Entered | Variables Removed | Method |
|---|---|---|---|
| 1 | DEEPROAD, LNROAD, bedrock or shallow well?(a) | . | Enter |
| a All requested variables entered. | |||
| b Dependent Variable: LNCHLOR | |||
| Model | R | R Square | Adjusted R Square | Std. Error of the Estimate |
|---|---|---|---|---|
| 1 | .439(a) | .192 | .142 | .55198 |
| a Predictors: (Constant), DEEPROAD, LNROAD, bedrock or shallow well? | ||||
| Model | Sum of Squares | df | Mean Square | F | Sig. | |
|---|---|---|---|---|---|---|
| 1 | Regression | 3.486 | 3 | 1.162 | 3.814 | .016(a) |
| Residual | 14.625 | 48 | .305 | |
|
|
| Total | 18.111 | 51 | |
|
|
|
| a Predictors: (Constant), DEEPROAD, LNROAD, bedrock or shallow well? | ||||||
| b Dependent Variable: LNCHLOR | ||||||
| |
Unstandardized Coefficients | Standardized Coefficients | t | Sig. | ||
|---|---|---|---|---|---|---|
| Model | B | Std. Error | Beta | |||
| 1 | (Constant) | 3.941 | .816 | |
4.828 | .000 |
| bedrock or shallow well? | -2.917 | .910 | -1.948 | -3.207 | .002 | |
| LNROAD | -1.109 | .384 | -.862 | -2.886 | .006 | |
| DEEPROAD | 1.256 | .427 | 1.979 | 2.942 | .005 | |
| a Dependent Variable: LNCHLOR | ||||||
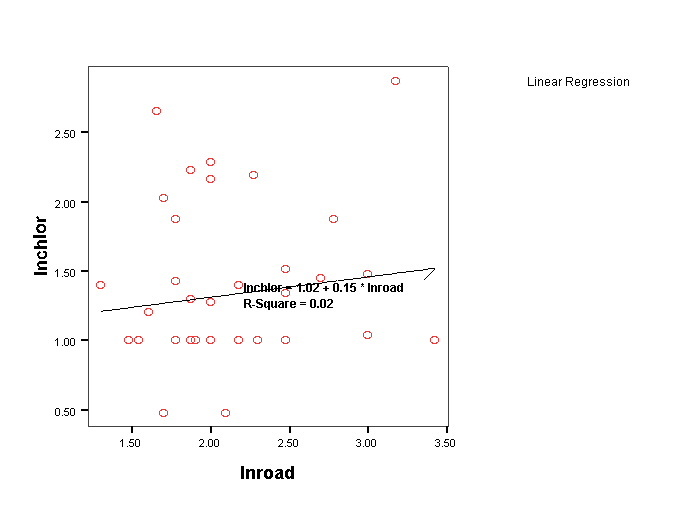
Page 91 Figure 3.6 Regression of log chloride concentration on log distance from road, with slope and intercept dummy variables for well type.
NOTE: SPSS will not allow you to include two regression lines and the data points as shown in this figure. However, you can graph one regression line and the data points, as shown below.
Page 91 Figure 3.7 Separate regression for shallow (left) and deep (right) wells; same line as in Figure 3.6.
USE ALL.
COMPUTE filter_$=(deep=0).
VARIABLE LABEL filter_$ 'deep=0 (FILTER)'.
VALUE LABELS filter_$  0 'Not Selected' 1 'Selected'.
FILTER BY filter_$.
EXECUTE.

IGRAPH
 /X1 = VAR(lnroad)
 /Y = VAR (lnchlor)
 /FITLINE METHOD = REGRESSION  LINEAR LINE = TOTAL
 /SCATTER COINCIDENT = NONE.
Interactive Graph
USE ALL.
COMPUTE filter_$=(deep=1).
VARIABLE LABEL filter_$ 'deep=1 (FILTER)'.
VALUE LABELS filter_$  0 'Not Selected' 1 'Selected'.
FILTER BY filter_$.
EXECUTE.

USE ALL.
IGRAPH
 /X1 = VAR(lnroad)
 /Y = VAR (lnchlor)
 /FITLINE METHOD = REGRESSION  LINEAR LINE = TOTAL
 /SCATTER COINCIDENT = NONE.
Interactive Graph
Oneway analysis of variance
Page 93 Table 3.5 Cancer, bedrock and radon in 26 counties.
GET FILE 'd:appsrwgdataradon.sav'.

USE ALL.
SELECT IF(number > 0).
EXECUTE.

if reading=1 area=1.
if fringe=1 area=2.
if control=1 area=3.

recode radon (0 thru 1.5=1) into mnradon.
recode radon (1.6 thru 2.45=2) into mnradon.
recode radon (2.5 thru 10.0=3) into mnradon.

compute lowradon=0.
if mnradon=1 lowradon=1.
compute midradon=0.
if mnradon=2 midradon=1.
execute.

list county cancer locale reading fringe mnradon lowradon midradon.
List
COUNTY         CANCER   LOCALE  READING   FRINGE  MNRADON LOWRADON MIDRADON

Orange           6.00        1        1        0     1.00     1.00      .00
Putnam          10.50        1        1        0     2.00      .00     1.00
Sussex           6.70        1        1        0     2.00      .00     1.00
Warren           6.00        1        1        0     3.00      .00      .00
Morris           6.10        1        1        0     1.00     1.00      .00
Hunterdon        6.70        1        1        0     3.00      .00      .00
Berks            5.20        2        0        1     3.00      .00      .00
Lehigh           5.60        2        0        1     3.00      .00      .00
Northampton      5.80        2        0        1     3.00      .00      .00
Pike             4.50        2        0        1     1.00     1.00      .00
Dutchess         5.50        2        0        1     2.00      .00     1.00
Sullivan         5.40        2        0        1     1.00     1.00      .00
Ulster           6.30        2        0        1     1.00     1.00      .00
Columbia         6.30        3        0        0     2.00      .00     1.00
Delaware         4.30        3        0        0     2.00      .00     1.00
Greene           4.00        3        0        0     2.00      .00     1.00
Otsego           5.90        3        0        0     2.00      .00     1.00
Tioga            4.70        3        0        0     2.00      .00     1.00
Carbon           4.80        3        0        0     2.00      .00     1.00
Lebanon          5.80        3        0        0     3.00      .00      .00
Lackawanna       5.40        3        0        0     1.00     1.00      .00
Luzerne          5.20        3        0        0     1.00     1.00      .00
Schuylkill       3.60        3        0        0     3.00      .00      .00
Susquehanna      4.30        3        0        0     1.00     1.00      .00
Wayne            3.50        3        0        0     1.00     1.00      .00
Wyoming          6.90        3        0        0     2.00      .00     1.00

Number of cases read:  26    Number of cases listed:  26
Page 94 Table 3.6 Relation between cancer rate and bedrock area.
REGRESSION
  /VAR=cancer reading fringe
  /DEPENDENT cancer
  /METHOD=TEST(reading fringe).
Regression
| Model | Variables Entered | Variables Removed | Method |
|---|---|---|---|
| 1 | Fringe area dummy, Reading Prong dummy | . | Test |
| a Dependent Variable: Wt.Female Lung Cancer (x10^-5/y | |||
| Model | R | R Square | Adjusted R Square | Std. Error of the Estimate |
|---|---|---|---|---|
| 1 | .598(a) | .358 | .302 | 1.14848 |
| a Predictors: (Constant), Fringe area dummy, Reading Prong dummy | ||||
| Model | Sum of Squares | df | Mean Square | F | Sig. | R Square Change | ||
|---|---|---|---|---|---|---|---|---|
| 1 | Subset Tests | Reading Prong dummy, Fringe area dummy | 16.909 | 2 | 8.454 | 6.410 | .006(a) | .358 |
| Regression | 16.909 | 2 | 8.454 | 6.410 | .006(b) | |
||
| Residual | 30.337 | 23 | 1.319 | |
|
|
||
| Total | 47.246 | 25 | |
|
|
|
||
| a Tested against the full model. | ||||||||
| b Predictors in the Full Model: (Constant), Fringe area dummy, Reading Prong dummy. | ||||||||
| c Dependent Variable: Wt.Female Lung Cancer (x10^-5/y | ||||||||
| |
Unstandardized Coefficients | Standardized Coefficients | t | Sig. | ||
|---|---|---|---|---|---|---|
| Model | B | Std. Error | Beta | |||
| 1 | (Constant) | 4.977 | .319 | |
15.625 | .000 |
| Reading Prong dummy | 2.023 | .567 | .632 | 3.569 | .002 | |
| Fringe area dummy | .495 | .538 | .163 | .918 | .368 | |
| a Dependent Variable: Wt.Female Lung Cancer (x10^-5/y | ||||||
ONEWAY
  cancer BY area.
Oneway
| |
Sum of Squares | df | Mean Square | F | Sig. |
|---|---|---|---|---|---|
| Between Groups | 16.909 | 2 | 8.454 | 6.410 | .006 |
| Within Groups | 30.337 | 23 | 1.319 | |
|
| Total | 47.246 | 25 | |
|
|
Twoway analysis of variance
Page 96 Table 3.7 Relation among cancer rate, bedrock area, and rado n.
REGRESSION
  /VAR=cancer reading fringe lowradon midradon
  /DEPENDENT cancer
  /METHOD=TEST(reading fringe) (lowradon midradon).
Regression
| Model | Variables Entered | Variables Removed | Method |
|---|---|---|---|
| 1 | MIDRADON, Reading Prong dummy, Fringe area dummy, LOWRADON | . | Test |
| a Dependent Variable: Wt.Female Lung Cancer (x10^-5/y | |||
| Model | R | R Square | Adjusted R Square | Std. Error of the Estimate |
|---|---|---|---|---|
| 1 | .684(a) | .468 | .367 | 1.09376 |
| a Predictors: (Constant), MIDRADON, Reading Prong dummy, Fringe area dummy, LOWRADON | ||||
| Model | Sum of Squares | df | Mean Square | F | Sig. | R Square Change | ||
|---|---|---|---|---|---|---|---|---|
| 1 | Subset Tests | Reading Prong dummy, Fringe area dummy | 19.285 | 2 | 9.642 | 8.060 | .003(a) | .408 |
| LOWRADON, MIDRADON | 5.215 | 2 | 2.607 | 2.180 | .138(a) | .110 | ||
| Regression | 22.124 | 4 | 5.531 | 4.623 | .008(b) | |
||
| Residual | 25.123 | 21 | 1.196 | |
|
|
||
| Total | 47.246 | 25 | |
|
|
|
||
| a Tested against the full model. | ||||||||
| b Predictors in the Full Model: (Constant), MIDRADON, Reading Prong dummy, Fringe area dummy, LOWRADON. | ||||||||
| c Dependent Variable: Wt.Female Lung Cancer (x10^-5/y | ||||||||
| |
Unstandardized Coefficients | Standardized Coefficients | t | Sig. | ||
|---|---|---|---|---|---|---|
| Model | B | Std. Error | Beta | |||
| 1 | (Constant) | 4.525 | .528 | |
8.569 | .000 |
| Reading Prong dummy | 2.212 | .551 | .691 | 4.014 | .001 | |
| Fringe area dummy | .867 | .549 | .285 | 1.579 | .129 | |
| LOWRADON | -.117 | .556 | -.041 | -.210 | .836 | |
| MIDRADON | .906 | .576 | .327 | 1.573 | .131 | |
| a Dependent Variable: Wt.Female Lung Cancer (x10^-5/y | ||||||
UNIANOVA
  cancer  BY area mnradon
  /DESIGN = area mnradon.
Univariate analysis of variance
| |
N | |
|---|---|---|
| AREA | 1.00 | 6 |
| 2.00 | 7 | |
| 3.00 | 13 | |
| MNRADON | 1.00 | 9 |
| 2.00 | 10 | |
| 3.00 | 7 | |
| Source | Type III Sum of Squares | df | Mean Square | F | Sig. |
|---|---|---|---|---|---|
| Corrected Model | 22.124(a) | 4 | 5.531 | 4.623 | .008 |
| Intercept | 784.039 | 1 | 784.039 | 655.380 | .000 |
| AREA | 19.285 | 2 | 9.642 | 8.060 | .003 |
| MNRADON | 5.215 | 2 | 2.607 | 2.180 | .138 |
| Error | 25.123 | 21 | 1.196 | |
|
| Total | 855.900 | 26 | |
|
|
| Corrected Total | 47.246 | 25 | |
|
|
| a R Squared = .468 (Adjusted R Squared = .367) | |||||
Page 98 Table 3.8 Relation among cancer rate, bedrock area, and radon, with interaction.
compute x1x3=reading*lowradon.
compute x1x4=reading*midradon.
compute x2x3=fringe*lowradon.
compute x2x4=fringe*midradon.
execute.

REGRESSION
  /VAR cancer reading fringe lowradon midradon x1x3 x1x4 x2x3 x2x4
  /DEPENDENT cancer
  /METHOD=TEST(reading fringe lowradon midradon) (x1x3 x1x4 x2x3 x2x4).
Regression
| Model | Variables Entered | Variables Removed | Method |
|---|---|---|---|
| 1 | X2X4, X1X4, X1X3, X2X3, MIDRADON, LOWRADON, Fringe area dummy, Reading Prong dummy | . | Test |
| a Dependent Variable: Wt.Female Lung Cancer (x10^-5/y | |||
| Model | R | R Square | Adjusted R Square | Std. Error of the Estimate |
|---|---|---|---|---|
| 1 | .742(a) | .551 | .340 | 1.11701 |
| a Predictors: (Constant), X2X4, X1X4, X1X3, X2X3, MIDRADON, LOWRADON, Fringe area dummy, Reading Prong dummy | ||||
| Model | Sum of Squares | df | Mean Square | F | Sig. | R Square Change | ||
|---|---|---|---|---|---|---|---|---|
| 1 | Subset Tests | Reading Prong dummy, Fringe area dummy, LOWRADON, MIDRADON | 4.945 | 4 | 1.236 | .991 | .439(a) | .105 |
| X1X3, X1X4, X2X3, X2X4 | 3.912 | 4 | .978 | .784 | .551(a) | .083 | ||
| Regression | 26.035 | 8 | 3.254 | 2.608 | .046(b) | |
||
| Residual | 21.211 | 17 | 1.248 | |
|
|
||
| Total | 47.246 | 25 | |
|
|
|
||
| a Tested against the full model. | ||||||||
| b Predictors in the Full Model: (Constant), X2X4, X1X4, X1X3, X2X3, MIDRADON, LOWRADON, Fringe area dummy, Reading Prong dummy. | ||||||||
| c Dependent Variable: Wt.Female Lung Cancer (x10^-5/y | ||||||||
| |
Unstandardized Coefficients | Standardized Coefficients | t | Sig. | ||
|---|---|---|---|---|---|---|
| Model | B | Std. Error | Beta | |||
| 1 | (Constant) | 4.700 | .790 | |
5.951 | .000 |
| Reading Prong dummy | 1.650 | 1.117 | .516 | 1.477 | .158 | |
| Fringe area dummy | .833 | 1.020 | .274 | .817 | .425 | |
| LOWRADON | -.100 | .967 | -.035 | -.103 | .919 | |
| MIDRADON | .571 | .896 | .206 | .638 | .532 | |
| X1X3 | -.200 | 1.478 | -.040 | -.135 | .894 | |
| X1X4 | 1.679 | 1.432 | .332 | 1.172 | .257 | |
| X2X3 | -3.333E-02 | 1.330 | -.008 | -.025 | .980 | |
| X2X4 | -.605 | 1.570 | -.086 | -.385 | .705 | |
| a Dependent Variable: Wt.Female Lung Cancer (x10^-5/y | ||||||
UNIANOVA  cancer  BY area mnradon
  /DESIGN = area mnradon area*mnradon.
Univariate analysis of variance
| |
N | |
|---|---|---|
| AREA | 1.00 | 6 |
| 2.00 | 7 | |
| 3.00 | 13 | |
| MNRADON | 1.00 | 9 |
| 2.00 | 10 | |
| 3.00 | 7 | |
| Source | Type III Sum of Squares | df | Mean Square | F | Sig. |
|---|---|---|---|---|---|
| Corrected Model | 26.035(a) | 8 | 3.254 | 2.608 | .046 |
| Intercept | 666.210 | 1 | 666.210 | 533.949 | .000 |
| AREA | 17.400 | 2 | 8.700 | 6.973 | .006 |
| MNRADON | 4.358 | 2 | 2.179 | 1.746 | .204 |
| AREA * MNRADON | 3.912 | 4 | .978 | .784 | .551 |
| Error | 21.211 | 17 | 1.248 | |
|
| Total | 855.900 | 26 | |
|
|
| Corrected Total | 47.246 | 25 | |
|
|
| a R Squared = .551 (Adjusted R Squared = .340) | |||||
Page 99 Table 3.9 Effect coding of bedrock area from Table 3.5.
if area=1 rev1=1.
if area=2 rev1=0.
if area=3 rev1=-1.
if area=1 fev2=0.
if area=2 fev2=1.
if area=3 fev2=-1.
execute.

list county area reading ereading fringe efringe.
List
COUNTY          AREA  READING EREADING   FRINGE  EFRINGE

Orange          1.00        1        1        0        0
Putnam          1.00        1        1        0        0
Sussex          1.00        1        1        0        0
Warren          1.00        1        1        0        0
Morris          1.00        1        1        0        0
Hunterdon       1.00        1        1        0        0
Berks           2.00        0        0        1        1
Lehigh          2.00        0        0        1        1
Northampton     2.00        0        0        1        1
Pike            2.00        0        0        1        1
Dutchess        2.00        0        0        1        1
Sullivan        2.00        0        0        1        1
Ulster          2.00        0        0        1        1
Columbia        3.00        0       -1        0       -1
Delaware        3.00        0       -1        0       -1
Greene          3.00        0       -1        0       -1
Otsego          3.00        0       -1        0       -1
Tioga           3.00        0       -1        0       -1
Carbon          3.00        0       -1        0       -1
Lebanon         3.00        0       -1        0       -1
Lackawanna      3.00        0       -1        0       -1
Luzerne         3.00        0       -1        0       -1
Schuylkill      3.00        0       -1        0       -1
Susquehanna     3.00        0       -1        0       -1
Wayne           3.00        0       -1        0       -1
Wyoming         3.00        0       -1        0       -1

Number of cases read:  26    Number of cases listed:  26
Page 100 Table 3.10 Relation among cancer rate, bedrock area, and radon.
compute v3=lowradon.
if mnradon=3 v3=-1.
compute v4=midradon.
if mnradon=3 v4=-1.
compute v1v3=ereading*v3.
compute v1v4=ereading*v4.
compute v2v3=efringe*v3.
compute v2v4=efringe*v4.
execute.

REGRESSION
 /VAR cancer ereading efringe v3 v4 v1v3 v1v4 v2v3 v2v4
 /DEPENDENT cancer
 /METHOD=TEST (ereading efringe v3 v4) (v1v3 v1v4 v2v3 v2v4).
Regression
| Model | Variables Entered | Variables Removed | Method |
|---|---|---|---|
| 1 | V2V4, effects-coded fringe, V3, V1V3, V2V3, effects-coded Reading, V4, V1V4 | . | Test |
| a Dependent Variable: Wt.Female Lung Cancer (x10^-5/y | |||
| Model | R | R Square | Adjusted R Square | Std. Error of the Estimate |
|---|---|---|---|---|
| 1 | .742(a) | .551 | .340 | 1.11701 |
| a Predictors: (Constant), V2V4, effects-coded fringe, V3, V1V3, V2V3, effects-coded Reading, V4, V1V4 | ||||
| Model | Sum of Squares | df | Mean Square | F | Sig. | R Square Change | ||
|---|---|---|---|---|---|---|---|---|
| 1 | Subset Tests | effects-coded Reading, effects-coded fringe, V3, V4 | 21.612 | 4 | 5.403 | 4.330 | .013(a) | .457 |
| V1V3, V1V4, V2V3, V2V4 | 3.912 | 4 | .978 | .784 | .551(a) | .083 | ||
| Regression | 26.035 | 8 | 3.254 | 2.608 | .046(b) | |
||
| Residual | 21.211 | 17 | 1.248 | |
|
|
||
| Total | 47.246 | 25 | |
|
|
|
||
| a Tested against the full model. | ||||||||
| b Predictors in the Full Model: (Constant), V2V4, effects-coded fringe, V3, V1V3, V2V3, effects-coded Reading, V4, V1V4. | ||||||||
| c Dependent Variable: Wt.Female Lung Cancer (x10^-5/y | ||||||||
| |
Unstandardized Coefficients | Standardized Coefficients | t | Sig. | ||
|---|---|---|---|---|---|---|
| Model | B | Std. Error | Beta | |||
| 1 | (Constant) | 5.778 | .250 | |
23.107 | .000 |
| effects-coded Reading | 1.222 | .363 | .735 | 3.365 | .004 | |
| effects-coded fringe | -.301 | .374 | -.189 | -.804 | .432 | |
| V3 | -.428 | .336 | -.248 | -1.276 | .219 | |
| V4 | .679 | .372 | .403 | 1.824 | .086 | |
| V1V3 | -.522 | .501 | -.238 | -1.041 | .313 | |
| V1V4 | .921 | .526 | .465 | 1.750 | .098 | |
| V2V3 | .351 | .486 | .176 | .722 | .480 | |
| V2V4 | -.657 | .595 | -.318 | -1.103 | .285 | |
| a Dependent Variable: Wt.Female Lung Cancer (x10^-5/y | ||||||
UNIANOVA  cancer  BY area mnradon
  /DESIGN = area mnradon area*mnradon.
Univariate analysis of variance
| |
N | |
|---|---|---|
| AREA | 1.00 | 6 |
| 2.00 | 7 | |
| 3.00 | 13 | |
| MNRADON | 1.00 | 9 |
| 2.00 | 10 | |
| 3.00 | 7 | |
| Source | Type III Sum of Squares | df | Mean Square | F | Sig. |
|---|---|---|---|---|---|
| Corrected Model | 26.035(a) | 8 | 3.254 | 2.608 | .046 |
| Intercept | 666.210 | 1 | 666.210 | 533.949 | .000 |
| AREA | 17.400 | 2 | 8.700 | 6.973 | .006 |
| MNRADON | 4.358 | 2 | 2.179 | 1.746 | .204 |
| AREA * MNRADON | 3.912 | 4 | .978 | .784 | .551 |
| Error | 21.211 | 17 | 1.248 | |
|
| Total | 855.900 | 26 | |
|
|
| Corrected Total | 47.246 | 25 | |
|
|
| a R Squared = .551 (Adjusted R Squared = .340) | |||||

