When working with longitudinal data, there is often participant dropout. To examine when dropout occurs and to see if any variables predict dropout, we need to create a variable indicating when each person drops out of the study.
To start, here is a small example dataset with five time points.
data list list
/t1 t2 t3 t4 t5.
begin data.
5 . . . .
5 5 . . .
5 5 5 . .
5 5 5 5 .
5 5 5 5 5
. 5 . . .
5 . 5 . .
5 . 5 5 .
5 . . 5 5
end data.
Dropout is defined as the last wave of a study where there is any data for a particular person. This is different from just missing data, because someone could have missing data, but if they also have non missing data at a later wave, then they did not dropout.
In SPSS, we can use a series of logical statements and the special missing function, to determine at what wave a participant drops out of the study. Below, we do this by creating an indicator variable “v” that is 1 if someone has not yet dropped out at that wave and 0 otherwise. This is separate from if a person is simply missing data at a given wave, because true dropout will be missing at all later time points too. Then we accumulate v over all waves in the dropout variable.
* compute whether someone dropped out at any particular time point.
compute v = 1.
compute dropout = 0.
do repeat x=t1 to t5.
compute v = v * ~missing(x).
compute dropout = dropout + v.
end repeat.
execute.
Now we have a variable with the wave each participant dropped out of the study. If we had other non missing variables (e.g., demographics or from questionnaires at baseline), we could use these as predictors of when someone drops out to see if dropout appears random or is related to something (e.g., in an intervention, perhaps participants in the treatment or control group are more likely to drop out).
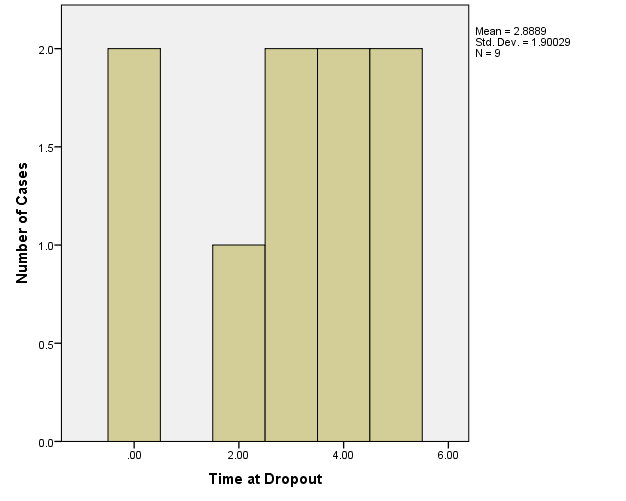
Just to see what the variable is like, here is a histogram of the dropout.
* Graphics Processing Language based on Leland Wilkinson's Grammar of Graphics.
GGRAPH /GRAPHDATASET NAME="dat" VARIABLES=dropout /GRAPHSPEC OURCE=INLINE.
BEGIN GPL SOURCE: s=userSource(id("dat"))
DATA: dropout=col(source(s), name("dropout"))
GUIDE: axis(dim(1), label("Time at Dropout"))
GUIDE: axis(dim(2), label("Number of Cases"))
ELEMENT: interval(position(summary.count(bin.rect(dropout))), shape.interior(shape.square))
END GPL.

Analyzing data when observations are missing or there is dropout can be a complex topic. There are many possibilities and techniques to try to use all available data and minimize bias from non random dropout or missingness. Applied Missing Data Analysis by Craig Enders is a nice book for beginners to learn more about what options exist.
