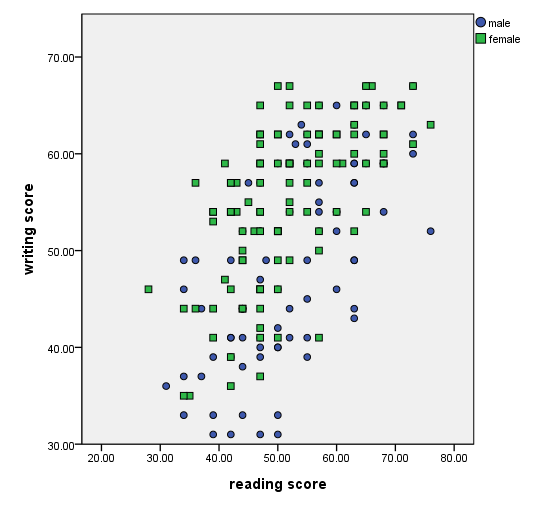
Suppose we are using the High School and Beyond data file (hsb2) which has test scores for 200 students, including 91 male and 109 female students. We could make a graph of their read and write scores as shown below with the graph command.
get file 'c:/spss/faq/hsb2.sav'.

graph
 /scatterplot(bivar) = write with read.
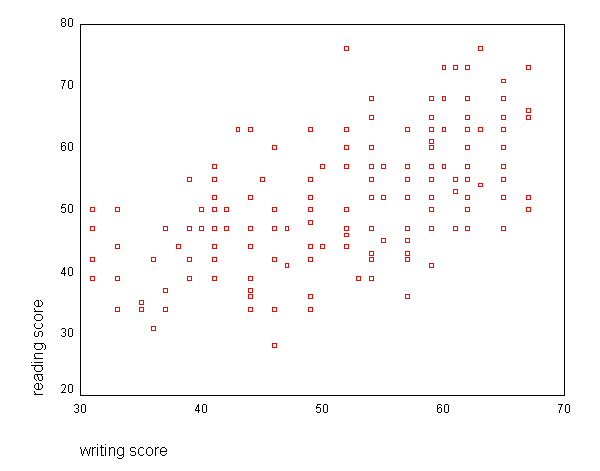
Now, let’s make a graph where we see the scores separately for the males and the females. We will use the by option with the graph command, and SPSS will assign different symbols to each group.
graph
  /scatterplot=read with write by female.
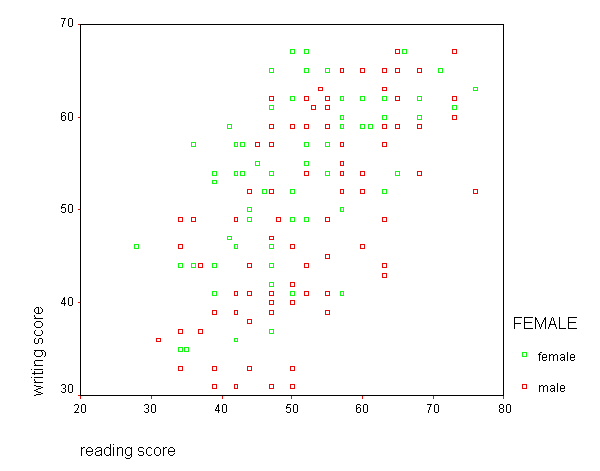
If you would like to change the symbols (SPSS calls them "markers") used for the groups, double click on the graph to open the chart editor, select select "format", then "marker", and then select the marker and the size that you would like. Click on "apply", "close" and then close the chart editor. If you would like to have different markers for the different groups, double click on the graph, double click on the legend on the right that labels the groups, and select (i.e., single click on) the group whose marker you would like to change. Next, select "format", "marker", and then select the marker and the size that you would like. Click on "apply", click on "close" and then close the chart editor.
graph
  /scatterplot=read with write by female.
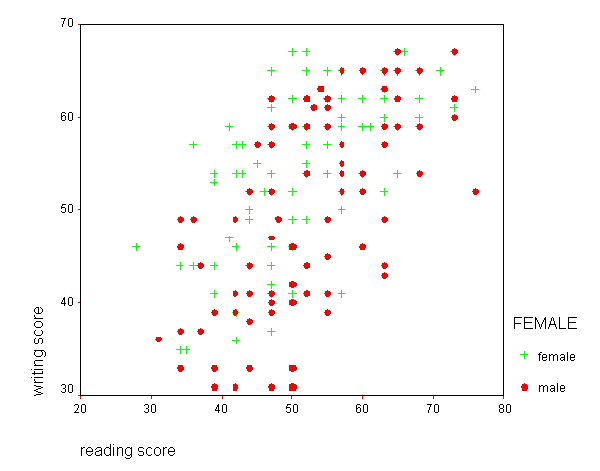
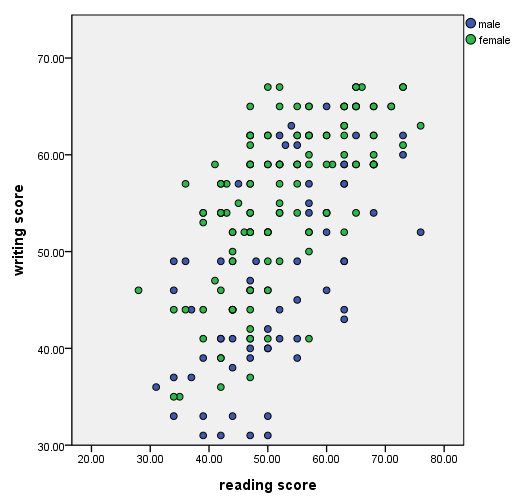
You can also use the ggraph command to create a scatterplot with different symbols. Below, we use color to distinguish between males and females.
GGRAPH
  /GRAPHDATASET NAME="graphdataset" VARIABLES=read write female
  /GRAPHSPEC SOURCE=INLINE.
BEGIN GPL
 SOURCE: s=userSource(id("graphdataset"))
 DATA: read=col(source(s), name("read"))
 DATA: write=col(source(s), name("write"))
 DATA: female=col(source(s), name("female"), unit.category())
 GUIDE: axis(dim(1), label("reading score"))
 GUIDE: axis(dim(2), label("writing score"))
 ELEMENT: point(position(read*write), color(female))
END GPL.
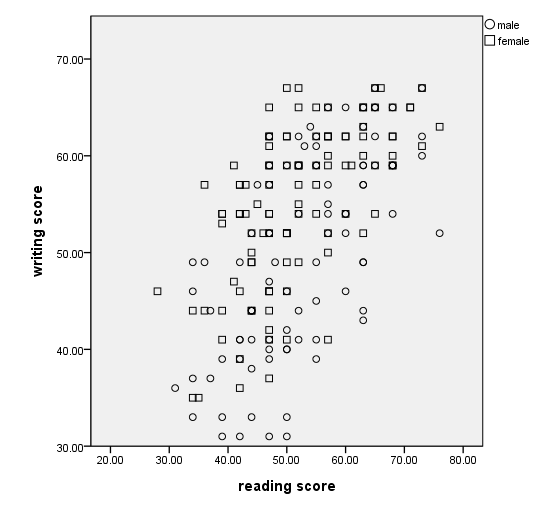
You can also use different symbol shapes to distinguish between males and females.
GGRAPH
  /GRAPHDATASET NAME="graphdataset" VARIABLES=read write female
  /GRAPHSPEC SOURCE=INLINE.
BEGIN GPL
 SOURCE: s=userSource(id("graphdataset"))
 DATA: read=col(source(s), name("read"))
 DATA: write=col(source(s), name("write"))
 DATA: female=col(source(s), name("female"), unit.category())
 GUIDE: axis(dim(1), label("reading score"))
 GUIDE: axis(dim(2), label("writing score"))
 ELEMENT: point(position(read*write), shape(female))
END GPL.
Of course, you can also use both different colors and different shapes.
GGRAPH
  /GRAPHDATASET NAME="graphdataset" VARIABLES=read write female
  /GRAPHSPEC SOURCE=INLINE.
BEGIN GPL
 SOURCE: s=userSource(id("graphdataset"))
 DATA: read=col(source(s), name("read"))
 DATA: write=col(source(s), name("write"))
 DATA: female=col(source(s), name("female"), unit.category())
 GUIDE: axis(dim(1), label("reading score"))
 GUIDE: axis(dim(2), label("writing score"))
 ELEMENT: point(position(read*write), color(female), shape(female))
END GPL.
