
It can be tricky to interpret the results from crosstabs in
SPSS. Consider the example below. We have included row
percentages, column percentages and cell percentages.
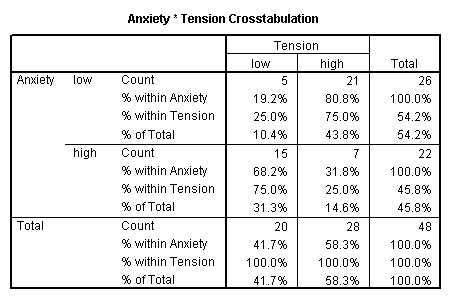
We have reproduced this table below, with footnotes explaining the
percentages.
Anxiety * Tension Crosstabulation
Tension
Total
low
high
Anxiety
low
Count
5
21
26
% within Anxiety
19.2%1
80.8%
100.0%
% within Tension
25.0%2
75.0%
54.2%4
% of Total
10.4%3
43.8%
54.2%4
high
Count
15
7
22
% within Anxiety
68.2%
31.8%
100.0%
% within Tension
75.0%
25.0%
45.8%
% of Total
31.3%
14.6%
45.8%
Total
Count
20
28
48
% within Anxiety
41.7%5
58.3%
100.0%
% within Tension
100.0%
100.0%
100.0%
% of Total
41.7%5
58.3%
100.0%
1. This is the row percentage (i.e., out of the 26 who are low anxiety,
5 are low tension, 5/26=19.2%).
2. This is the column percentage (i.e., out of the 20 who are low tension,
5 are low anxiety, 5/20=25%).
3. This is the cell percentage (i.e., out of all 48, 5 are low
anxiety and low tension, 5/48=10.4%).
4. This is the overall row percentage (i.e., out of all 48 people, 26 were
low anxiety, 26/48=54.2%).
5. This is the overall column percentage
(i.e., out of all 48 people, 20 were low tension, 20/48=41.7%).