Cronbach’s alpha is a measure of internal consistency, that is, how closely related a set of items are as a group. It is considered to be a measure of scale reliability. A “high” value for alpha does not imply that the measure is unidimensional. If, in addition to measuring internal consistency, you wish to provide evidence that the scale in question is unidimensional, additional analyses can be performed. Exploratory factor analysis is one method of checking dimensionality. Technically speaking, Cronbach’s alpha is not a statistical test – it is a coefficient of reliability (or consistency).
Cronbach’s alpha can be written as a function of the number of test items and the average inter-correlation among the items. Below, for conceptual purposes, we show the formula for the Cronbach’s alpha:
$$ \alpha = \frac{N \bar{c}}{\bar{v} + (N-1) \bar{c}}$$
Here $N$ is equal to the number of items, $\bar{c}$ is the average inter-item covariance among the items and $\bar{v}$ equals the average variance.
One can see from this formula that if you increase the number of items, you increase Cronbach’s alpha. Additionally, if the average inter-item correlation is low, alpha will be low. As the average inter-item correlation increases, Cronbach’s alpha increases as well (holding the number of items constant).
An example
Let’s work through an example of how to compute Cronbach’s alpha using SPSS, and how to check the dimensionality of the scale using factor analysis. For this example, we will use a dataset that contains four test items – q1, q2, q3 and q4. You can download the dataset by clicking on https://stats.idre.ucla.edu/wp-content/uploads/2016/02/alpha.sav. To compute Cronbach’s alpha for all four items – q1, q2, q3, q4 – use the reliability command:
RELIABILITY
  /VARIABLES=q1 q2 q3 q4.
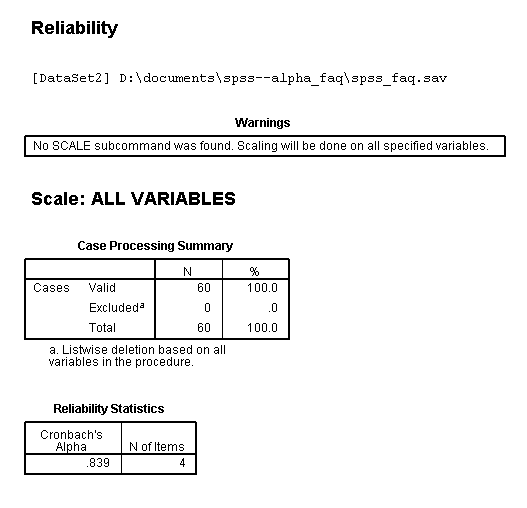
Here is the resulting output from the above syntax:

The alpha coefficient for the four items is .839, suggesting that the items have relatively high internal consistency. (Note that a reliability coefficient of .70 or higher is considered “acceptable” in most social science research situations.)
Hand calculation of Cronbach’s Alpha
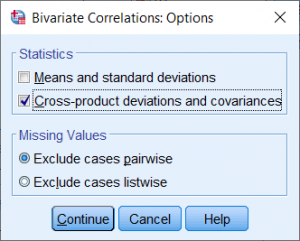
For demonstration purposes, here is how to calculate the results above by hand. In SPSS, you can obtain covariances by going to Analyze – Correlate – Bivariate. Then shift q1, q2,q3 and q4 to the Variables box and click Options. Under Statistics, check Cross-product deviations and covariances. Click Continue and OK to obtain output.
Below you will see a condensed version of the output. Notice that the diagonals (in bold) are the variances and the off-diagonals are the covariances. We only need to consider the covariances on the lower left triangle because this is a symmetric matrix.
| q1 | q2 | q3 | q4 | ||
| q1 | Covariance | 1.168 | .557 | .574 | .673 |
| q2 | Covariance | .557 | 1.012 | .690 | .720 |
| q3 | Covariance | .574 | .690 | 1.169 | .724 |
| q4 | Covariance | .673 | .720 | .724 | 1.291 |
Recall that $N=4$ is equal to the number of items, $\bar{c}$ is the average inter-item covariance among the items and $\bar{v}$ equals the average variance. Using the information from the table above, we can calculate each of these components via the following:
$$\bar{v} = (1.168 + 1.012 + 1.169 + 1.291)/4 = 4.64 / 4 = 1.16.$$
$$\bar{c} = (0.557 + 0.574 + 0.690 + 0.673 + 0.720 + 0.724)/6 = 3.938 / 6 = 0.656.$$
$$ \alpha = \frac{4 (0.656)}{(1.16) + (4-1) (0.656)}=2.624/3.128=0.839.$$
The results match our SPSS obtained Cronbach’s Alpha of 0.839.
Checking dimensionality
In addition to computing the alpha coefficient of reliability, we might also want to investigate the dimensionality of the scale. We can use the factor command to do this:
FACTOR
 /VARIABLES q1 q2 q3 q4
 /FORMAT SORT BLANK(.35).
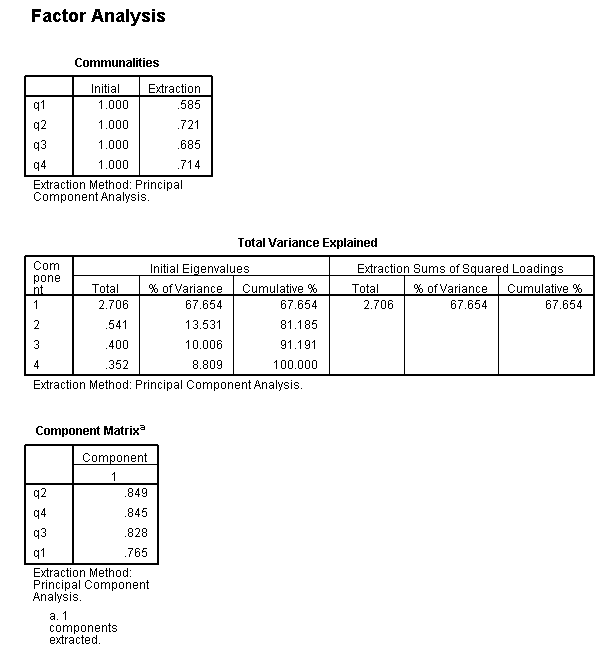
Here is the resulting output from the above syntax:

Looking at the table labeled Total Variance Explained, we see that the eigen value for the first factor is quite a bit larger than the eigen value for the next factor (2.7 versus 0.54). Additionally, the first factor accounts for 67% of the total variance. This suggests that the scale items are unidimensional.
For more information
- For more information about reading data in SPSS, see the SPSS Command Syntax Reference.
- For more information on Cronbach’s Alpha, see SPSS Library: My Coefficient Alpha is Negative!
- For more information about intraclass coefficients as a measure of reliability, see SPSS Library: Choosing an Intraclass Correlation Coefficient.

