NOTE: The output below was produced using SPSS version 20.
NOTE: Although commands are show in ALL CAPS, this is not necessary. We follow the SPSS convention of doing this to make it clear which parts of the syntax are SPSS commands, subcommands or keywords, and which parts are variable names (shown in lower case letters). SPSS is not case sensitive, so use whichever case is easiest for you.
1. Introduction
This module demonstrates how to obtain basic descriptive statistics using SPSS. We will use a data file containing data on 26 automobiles with their make, price, mpg, repair record, and whether the car was foreign or domestic. The data file is presented below.
MAKE PRICE MPG REP78 FOREIGN
AMC    4099 22 3 0
AMC    4749 17 3 0
AMC    3799 22 3 0
Audi   9690 17 5 1
Audi   6295 23 3 1
BMW    9735 25 4 1
Buick  4816 20 3 0
Buick  7827 15 4 0
Buick  5788 18 3 0
Buick  4453 26 3 0
Buick  5189 20 3 0
Buick 10372 16 3 0
Buick  4082 19 3 0
Cad.  11385 14 3 0
Cad.  14500 14 2 0
Cad.  15906 21 3 0
Chev.  3299 29 3 0
Chev.  5705 16 4 0
Chev.  4504 22 3 0
Chev.  5104 22 2 0
Chev.  3667 24 2 0
Chev.  3955 19 3 0
Datsun 6229 23 4 1
Datsun 4589 35 5 1
Datsun 5079 24 4 1
Datsun 8129 21 4 1
The program below reads the data and creates a temporary SPSS .sav file. The descriptive statistics shown in this module are all performed on this .sav file. The list of variables on the data list command is make (A8) price mpg rep78 foreign . The (A8) following make indicates that make is a character variable. The word free indicates “free field” input.
DATA LIST FREE/
   make (A8) price mpg  rep78 foreign .
BEGIN DATA.
AMC    4099 22 3 0
AMC    4749 17 3 0
AMC    3799 22 3 0
Audi   9690 17 5 1
Audi   6295 23 3 1
BMW    9735 25 4 1
Buick  4816 20 3 0
Buick  7827 15 4 0
Buick  5788 18 3 0
Buick  4453 26 3 0
Buick  5189 20 3 0
Buick 10372 16 3 0
Buick  4082 19 3 0
Cad.  11385 14 3 0
Cad.  14500 14 2 0
Cad.  15906 21 3 0
Chev.  3299 29 3 0
Chev.  5705 16 4 0
Chev.  4504 22 3 0
Chev.  5104 22 2 0
Chev.  3667 24 2 0
Chev.  3955 19 3 0
Datsun 6229 23 4 1
Datsun 4589 35 5 1
Datsun 5079 24 4 1
Datsun 8129 21 4 1
END DATA.
EXECUTE.

LIST
  /CASES=10.
EXECUTE.
The output of the list command is shown below. You can compare the program to the output below.
make        price      mpg    rep78  foreign

AMC       4099.00    22.00     3.00      .00
AMC       4749.00    17.00     3.00      .00
AMC       3799.00    22.00     3.00      .00
Audi      9690.00    17.00     5.00     1.00
Audi      6295.00    23.00     3.00     1.00
BMW       9735.00    25.00     4.00     1.00
Buick     4816.00    20.00     3.00      .00
Buick     7827.00    15.00     4.00      .00
Buick     5788.00    18.00     3.00      .00
Buick     4453.00    26.00     3.00      .00

Number of cases read:  10    Number of cases listed:  10
2. Using the frequencies or crosstabs command for counts
Both of these commands are used for obtaining information on the number of cases that have a certain characteristic.
Frequencies
This command is used to obtain counts on a single variable’s values.
Crosstabs
This command is used to obtain counts on more than one variable’s values. For example, to obtain counts on foreign cars with good repair record, and domestic cars with poor repair records.
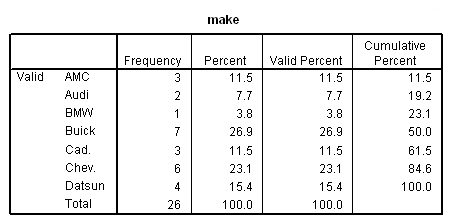
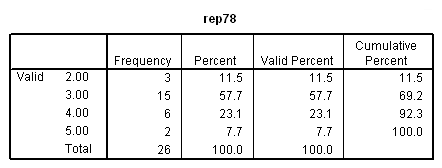
We can use frequencies to produce tables of counts for individual variables. Below, we use it to make frequency tables for make, rep78 and foreign. Since any command name can be abbreviated to three characters if those three characters are unique to that command, the frequencies can be abbreviated freq. The var subcommand is on a separate line and preceded by a forward slash ( / ). Subcommands may be placed on the same line as the command name. The first subcommand does not have to be preceded by a slash, but doing so forms a good habit.
FREQ
  /VARIABLES= make.

FREQ
  /VARIABLES= rep78.

FREQ
  /VAR= foreign.
Here is the output produced by the frequencies commands above.
Instead of having three separate frequencies, we could have done this all in one step as illustrated below.
FREQ
  /VARIABLES= make rep78 foreign.
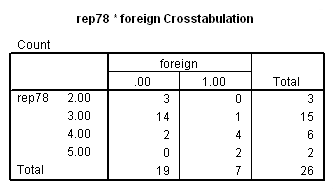
Let’s use crosstabs to look at a cross tabulation of the repair history of the cars (rep78) for foreign and domestic cars (foreign). The crosstabs command for this is shown below.
CROSSTABS
  /TABLES=rep78 BY foreign.
This is the output produced.
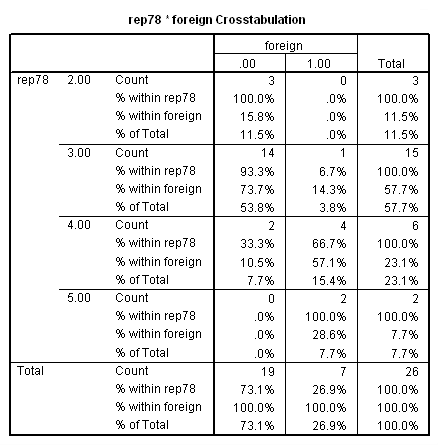
We can also show more information by using the count, row, column and total specifications on the cell subcommand to request the printing of the row percentages, column percentages and total percentage along with the count. Note that these specifications come after the = on the cell subcommand. Generally, the form is “subcommand=specifications list”. Subcommands are preceded by a forward slash ( / ).
CROSSTABS
  /TABLES=rep78 BY foreign
  /CELLS= COUNT ROW COLUMN TOTAL.
The output is shown below.
Note: The order of the options does not matter. We would have gotten the same output had we written the command like this:
CROSSTABS
  /TABLES=rep78 BY foreign
  /CELLS= TOTAL COUNT ROW COLUMN.
3. Using the descriptives or means command for summary statistics
Both of these procedures are used for obtaining descriptive statistics like means and standard deviations.
Descriptives
This command is used to obtain descriptive statistics on a single variable.
Means
This command is used to obtain descriptive statistics on a variable at different levels of another variable. For example, to obtain mean mpg separately for foreign cars and domestic cars.
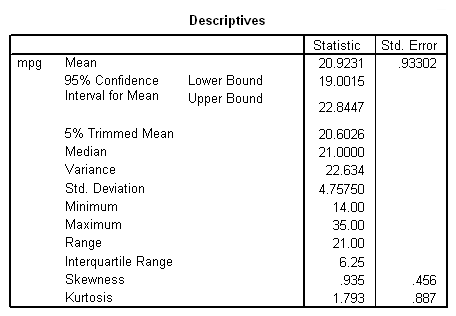
To produce summary statistics, descriptives can be used. Below, descriptives is used to get descriptive statistics for the variable mpg.
DESCRIPTIVES
  /VARIABLES=mpg.
The results of the descriptives are shown below.
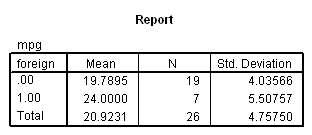
Suppose we would like to get the summary statistics separately for foreign and domestic cars (indicated by the variable foreign). We can use the means command and list foreign after the keyword by on the tables subcommand. The example below will produce separate results for the different values of foreign.
MEANS
  /TABLES=mpg BY foreign.
The results are presented separately for the 7 foreign cars (when foreign equals 1) and the 19 domestic cars (when foreign equals 0):
4. Using the examine command for detailed summary statistics
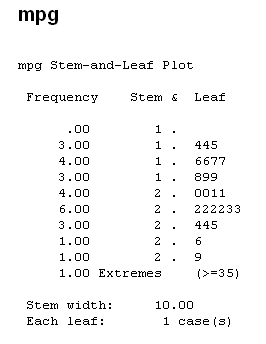
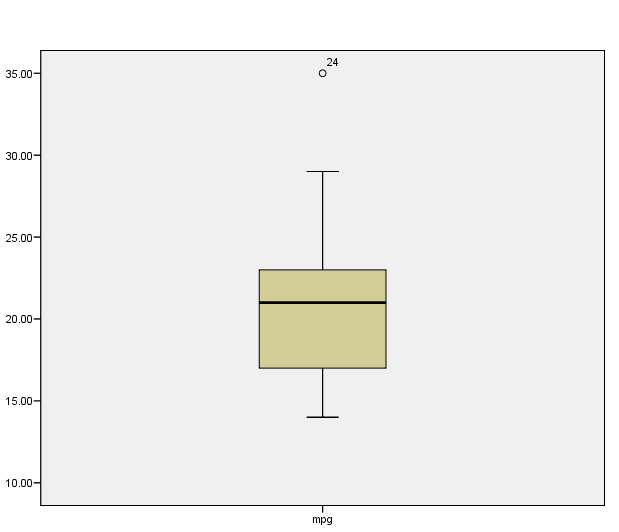
You can use examine to get more detailed summary statistics including median, variance and interquartile range, as well as descriptive plots.
EXAMINE
  /VARIABLES=mpg.
Below are the results of the examine command.
5. Problems to look out for
- If you make a cross tabulation table with crosstabs and one of the variables has large number of values (say 10 or more), the crosstab table could be very hard to read.
- When using the keyword by in examine, if you choose a by variable with a large number of values (say 5, 10, or more) it will produce a very large amount of output. In such cases, you may try to use the means command with a by keyword on the tables subcommand instead.
6. For more information
- For information on Statistical Tests in SPSS, see the SPSS Learning Module An Overview of Statistical Tests in SPSS.
- For more information about frequencies, crosstabs, descriptives, means and examine, see the appropriate chapters in the SPSS Command Syntax Reference Guide .


