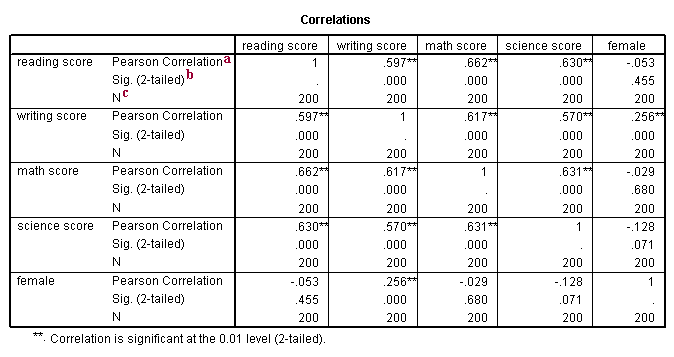
This page shows an example correlation with footnotes explaining the output. These data were collected on 200 high schools students and are scores on various tests, including science, math, reading and social studies (socst). The variable female is a dichotomous variable coded 1 if the student was female and 0 if male.
In the syntax below, the get file command is used to load the hsb2 data into SPSS. In quotes, you need to specify where the data file is located on your computer. Remember that you need to use the .sav extension and that you need to end the command with a period. By default, SPSS does a pairwise deletion of missing values. This means that as long as both variables in the correlation have valid values for a case, that case is included in the correlation. The /print subcommand is used to have the statistically significant correlations marked.
get file "c:\data\hsb2.sav".

correlations
 /variables = read write math science female
 /print = nosig.

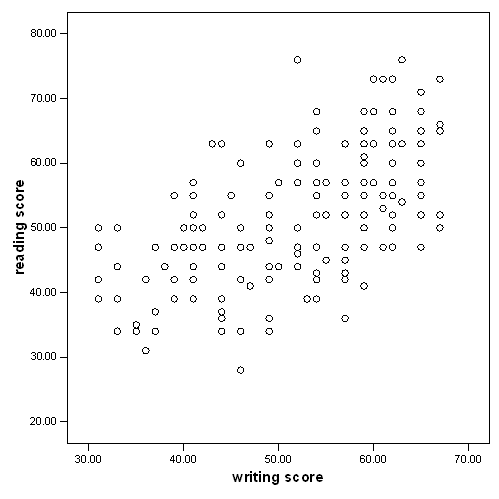
a. Pearson Correlation – These numbers measure the strength and direction of the linear relationship between the two variables. The correlation coefficient can range from -1 to +1, with -1 indicating a perfect negative correlation, +1 indicating a perfect positive correlation, and 0 indicating no correlation at all. (A variable correlated with itself will always have a correlation coefficient of 1.) You can think of the correlation coefficient as telling you the extent to which you can guess the value of one variable given a value of the other variable. From the scatterplot of the variables read and write below, we can see that the points tend along a line going from the bottom left to the upper right, which is the same as saying that the correlation is positive. The .597 is the numerical description of how tightly around the imaginary line the points lie. If the correlation was higher, the points would tend to be closer to the line; if it was smaller, they would tend to be further away from the line. Also note that, by definition, any variable correlated with itself has a correlation of 1.
b. Sig. (2-tailed) – This is the p-value associated with the correlation. The footnote under the correlation table explains what the single and double asterisks signify.
c. N – This is number of cases that was used in the correlation. Because we have no missing data in this data set, all correlations were based on all 200 cases in the data set. However, if some variables had missing values, the N’s would be different for the different correlations.
Scatterplot
graph
 /scatterplot(bivar) = write with read.

Correlation using listwise deletion of missing data
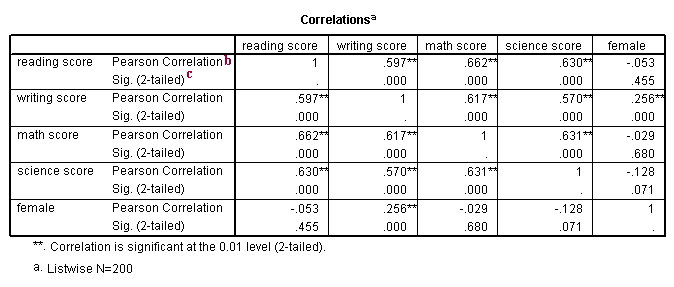
The correlations in the table below are interpreted in the same way as those above. The only difference is the way the missing values are handled. When you do a listwise deletion, as we do with the /missing = listwise subcommand, if a case has a missing value for any of the variables listed on the /variables subcommand, that case is eliminated from all correlations, even if there are valid values for the two variables in the current correlation. For example, if there was a missing value for the variable read, the case would still be excluded from the calculation of the correlation between write and math.
There are really no rules defining when you should use pairwise or listwise deletion. It depends on your purpose and whether it is important for exactly the same cases to be used in all of the correlations. If you have lots of missing data, some correlations could be based on many cases that are not included in other correlations. On the other hand, if you use a listwise deletion, you may not have many cases left to be used in the calculation.
Please note that SPSS sometimes includes footnotes as part of the output. We have left those intact and have started ours with the next letter of the alphabet.
correlations
 /variables = read write math science female
 /print = nosig
 /missing = listwise.

b. Pearson Correlation – This is the correlation between the two variables (one listed in the row, the other in the column). It is interpreted just as the correlations in the previous example.
c. Sig. (2-tailed) – This is the p-value associated with the correlation. The footnote under the correlation table explains what the single and double asterisks signify.
