Parallel coordinate plots are another way of looking a data. They enable researchers to view multiple variables simultaneously. There are two commands used to produce parallel coordinate plots, parcoord and parcord2 that we will be using. Here is how you can download the commands from ATS. You can download the parcoord command by typing search parcoord and you can download parcord2 by typing search parcord2 (see How can I use the search command to search for programs and get additional help? for more information about using search). Now let’s take a look at several examples using the hsb2 dataset.
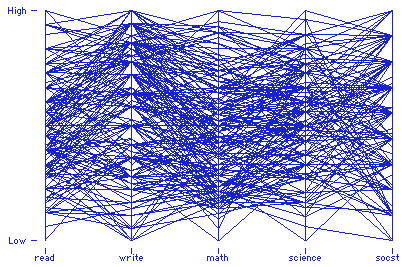
use https://stats.idre.ucla.edu/stat/data/hsb2parcoord read write math science socst
While this is kind of confusing, you can see that high scores on one variable do not necessarily guarantee high scores on all the other. Let's look at one variable, read, but include female and write.
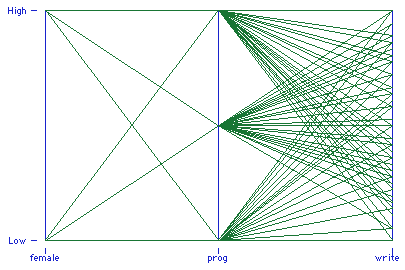
parcoord female prog write
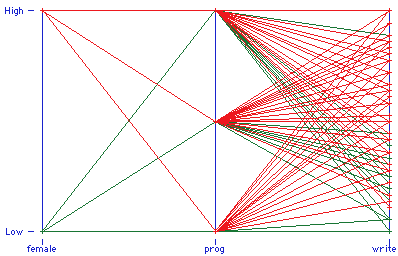
This is looking interesting but let's enhance the image by displaying males and females in different colors using the parcord2 command.
parcord2 female prog write, by(female)
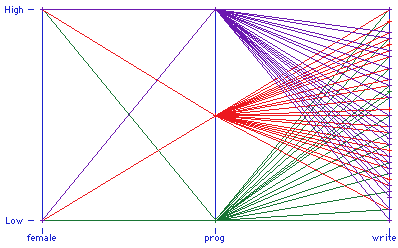
Finally, let's try one more variation. Let's color the lines by prog.
parcord2 female prog write, by(prog)


