Purpose: The purpose of this program is to allow a comparison between a univariate t-test and a multivariate t-squared test. The program creates a dataset with two variables, X and Y, and allows the user to vary 1) the difference between xbar1 and xbar2, 2) the difference between ybar1 and ybar2, 3) the correlation between X and Y and 4) the sample size. This program is useful for illustrating that while the univariate test for X and Y may be non-significant, the multivariate test may be significant.
Download: You can download this program from within Stata by typing search t2demo (see How can I used the search command to search for programs and get additional help? for more information about using search).
Use of program: To use this program, type t2demo in the Stata command window. A dialogue window with two pull-down menus and eight buttons will appear, as well as a graph of the bivariate distribution of X and Y for the two groups. To change the correlation between X and Y, click on the down-arrow to the right of
"r(xy) =", select the desired correlation and then click on the "change R, N" button. To change the sample size, click on the down-arrow to the right of "N = ", select the desired sample size and then click on the "change R, N" button. Note that this will change the sample size for both X and Y; the sample sizes cannot be independently altered (i.e., the program does not allow the sample sizes cannot be different). The value of Y1 can be made larger or smaller by clicking on the "Y1 + .05" or the "Y1 – .05" buttons on the left of the dialogue box, respectively. Likewise, the value of X1 can be altered by clicking on the "X1 + .05" and "X1 – .05" buttons. The resulting changes in the univariate and multivariate tests are displayed in the middle of the dialogue box. Press the "reset" button to reset the program to its default values. Press the "done" button to exit the program.Examples: The following shows the output from issuing the t2demo command.
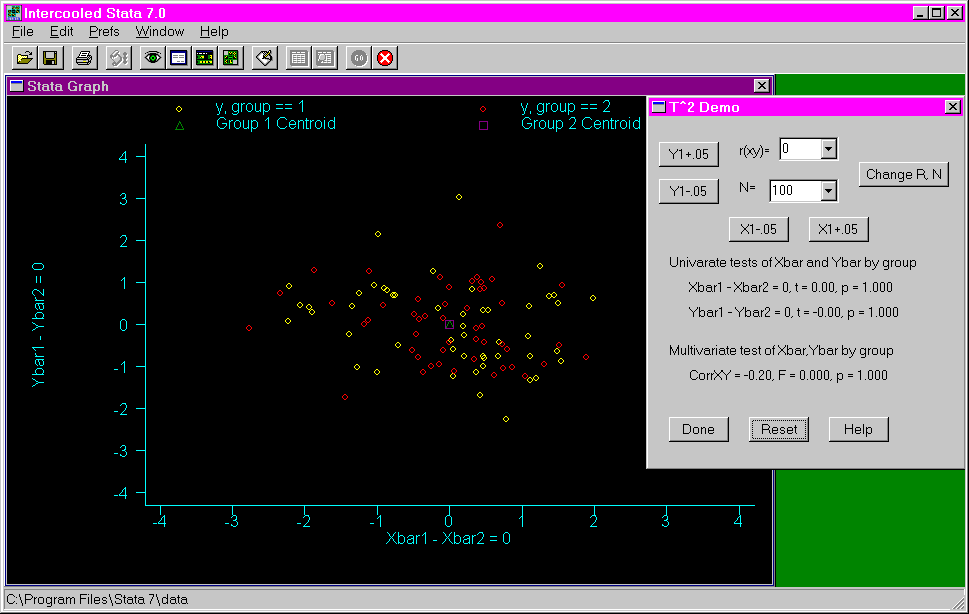
The following example shows the results of clicking on the "Y1 + .05" button three times. Notice the change in the t-value for Ybar and the F-value for the multivariate test.
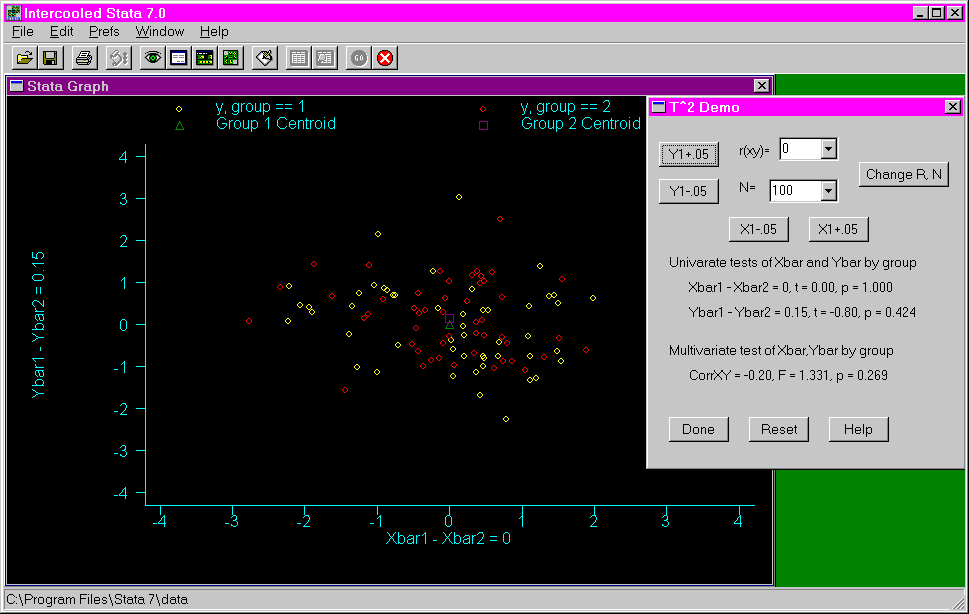
The following example shows the results of clicking on the "X1 + .05" button three times. Notice the change in the t-value for Xbar and that the F-test is now almost significant at the .05 alpha level.
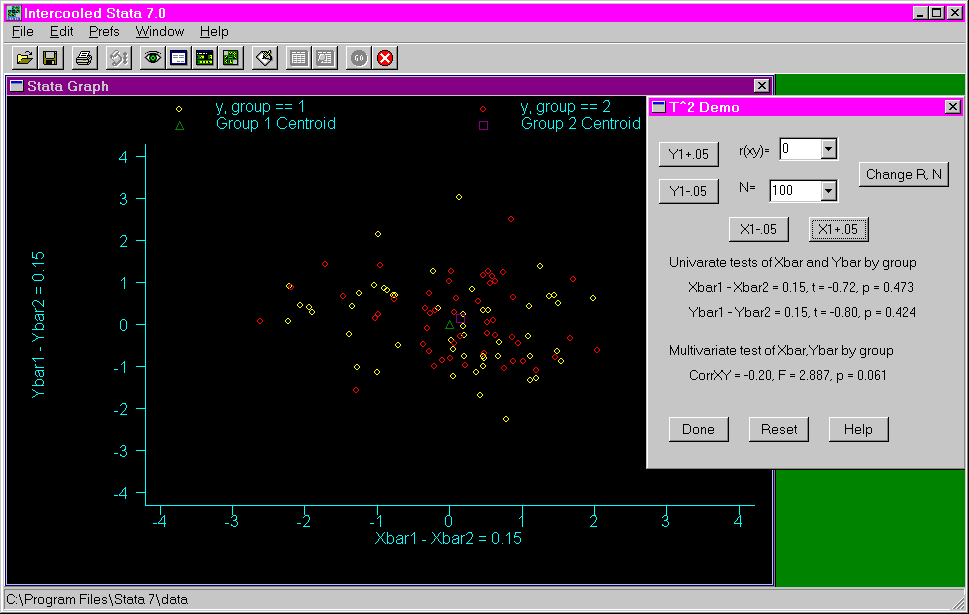
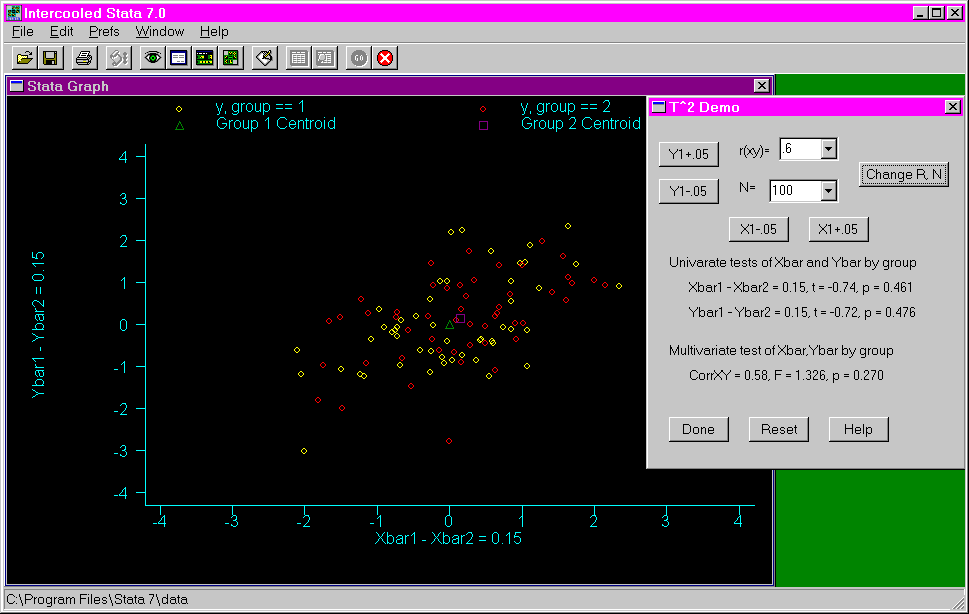
The following example shows the results of changing the correlation to .6. Notice that while the t-values for Xbar and Ybar did not change much, the F-value changed considerably and is no longer close to being significant.
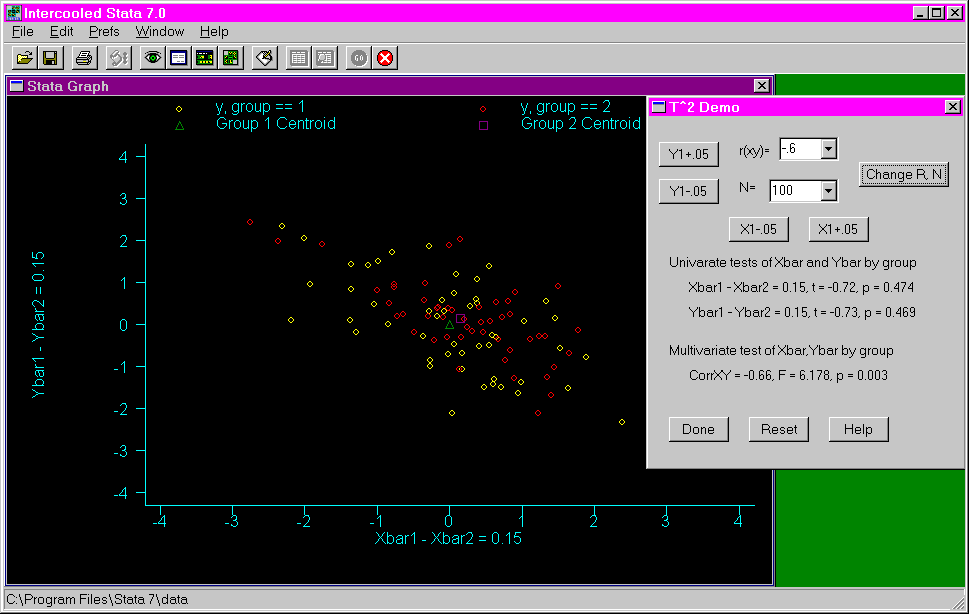
The following example shows the results of changing the correlation to -.6. Notice that while the t-values for both Xbar and Ybar did not change much, the F-value changed considerably and is now significant. While the F-test indicates a separation between the red and yellow dots, it is not obvious in the graph.
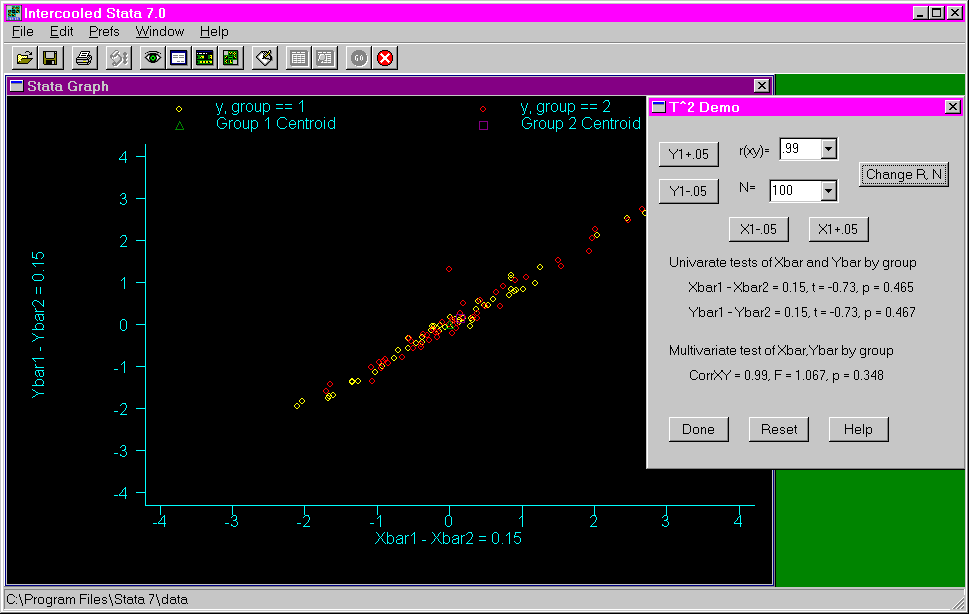
The following example shows the results of changing the correlation to .99. Notice that, again, the t-values for Xbar and Ybar did not change much, but the F-value changed considerably and is no longer significant. There is no clear separation of the red and yellow dots.
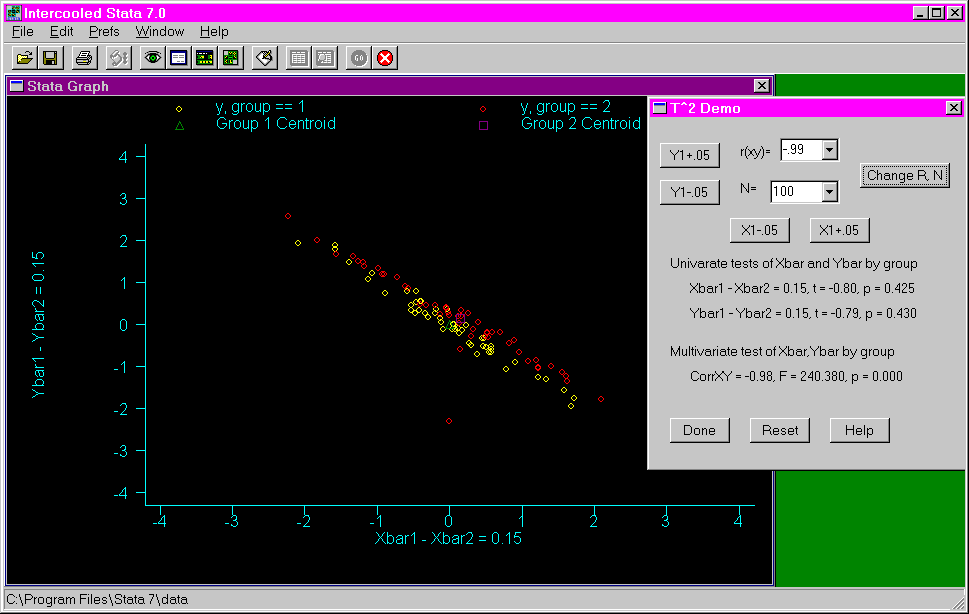
The following example shows the results of changing the correlation to -.99. Notice that the F-value is now huge and significant, and the separation of the red and yellow dots is obvious in the graph.
