Purpose: The purpose of this program is to show how the "width" or "range" of the confidence interval (CI) changes with the size of the sample drawn. This program also indicates the number of intervals that do not include the population mean. While the program shows a 95% confidence interval by default, this can be modified to show the effects of changing to, say, a 90% confidence interval. This program is useful for illustrating the relationship between the size of the sample, the confidence level and the "width" of the confidence intervals.
Download: You can download this program from within Stata by typing search cidemo (see How can I use the search command to search for programs and get additional help? for more information about using search).
Use of program: To use this program, type cidemo # in the Stata command window, where the number indicates the size of the sample to be drawn. The program will calculate the 95% confidence intervals for 50 samples, each with a mean of 50 and a standard deviation of 10. The number of intervals that do not include the population mean is displayed at the top of the Stata graph window, and this number is also returned in the Stata results window. The user can supply a different confidence level after the sample size.
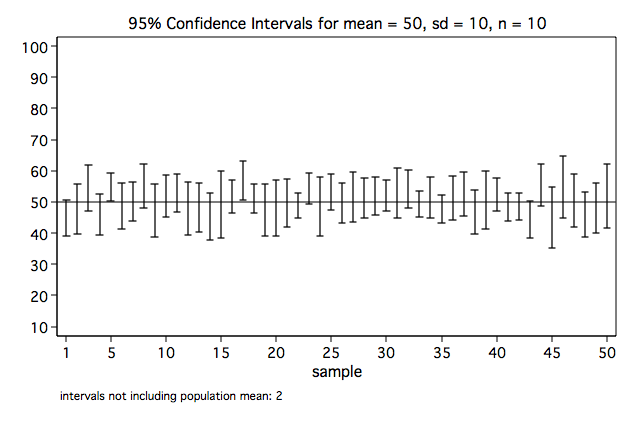
Examples: The following example uses a sample size (i.e., n) of 10. By default, a 95% confidence interval is displayed. The message at the top of the graph window indicates that three intervals do not include the population mean.
cidemo 10

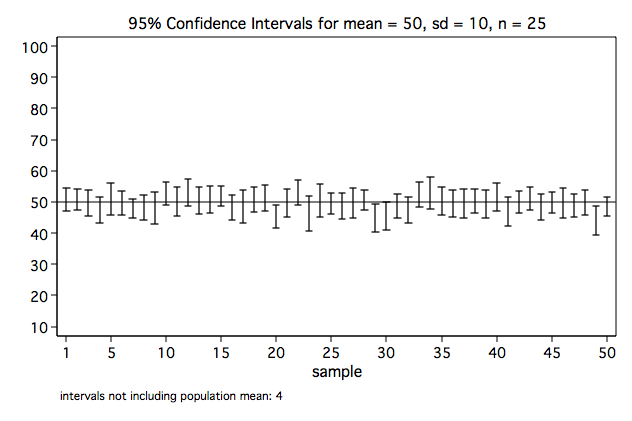
The following example uses a sample size of 25. Notice that the "width" of the intervals is much smaller than it was when the sample size was 10.
cidemo 25

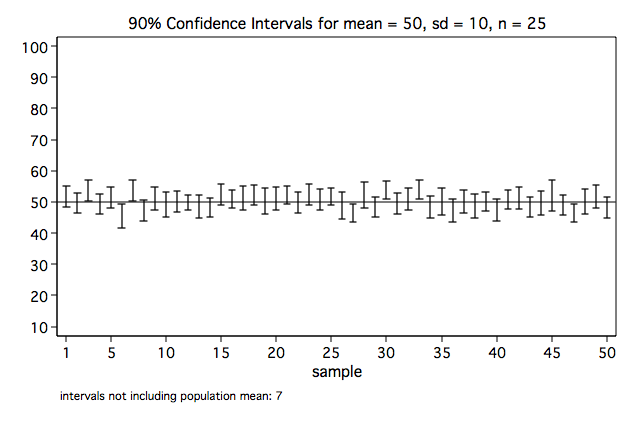
The following example is the same as the one above, except it uses a 90% confidence interval.
cidemo 25 .9

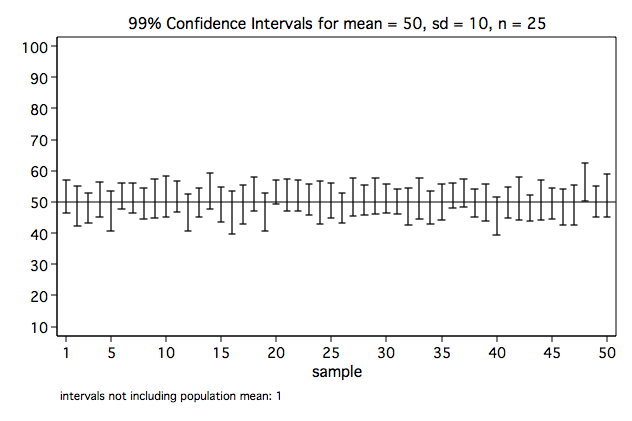
The following example is the same as the two above, except it uses a 99% confidence interval. Notice that the "width" of the intervals increases as the confidence level increases.
cidemo 25 .99

