Purpose: The purpose of this program is to graphically demonstrate the concept of correlation with the use of a scatterplot and a regression line. The user can select various sample sizes and correlations and see how these changes effect the graph.
Download: You can download this program from within Stata by typing search cordemo (see How can I use the search command to search for programs and get additional help? for more information about using search).
Use of program: To use this program, type cordemo in the Stata command window. A dialogue window will open, as will a Stata graph window. By default, the program will graph 100 randomly selected numbers that have a correlation of zero. Alternatively, the user can have the program begin with the desired correlation and sample size by specifying them immediately after the cordemo command. The user can increase or decrease the correlation by clicking on the "r + .1" or "r – .1" buttons in the dialogue window. The points and the regression line will move to reflect the changes made. The sample size can be altered by use of a pull-down menu to the right of "n = " and then clicking on the "redisplay" button. clicking on the "show movie" button will display the changes in the graph from a correlation of +1 to -1. A pull-down menu allows the user to control the speed of the frames of the movie. This can be done by clicking on the down-arrow to the right of "delay = ". The higher the number, the slower the movie. To exit the program, click on the "done" button.
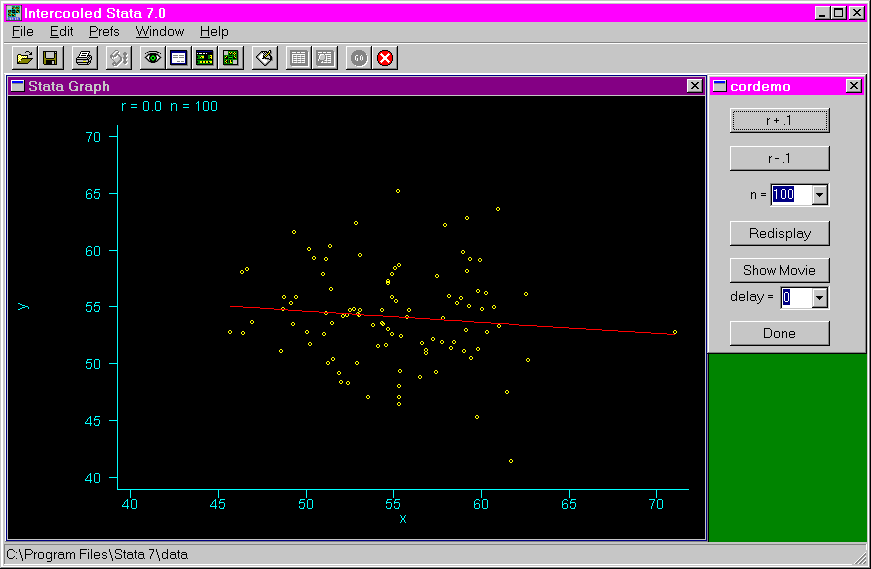
Examples: The following shows the result of issuing the cordemo command.

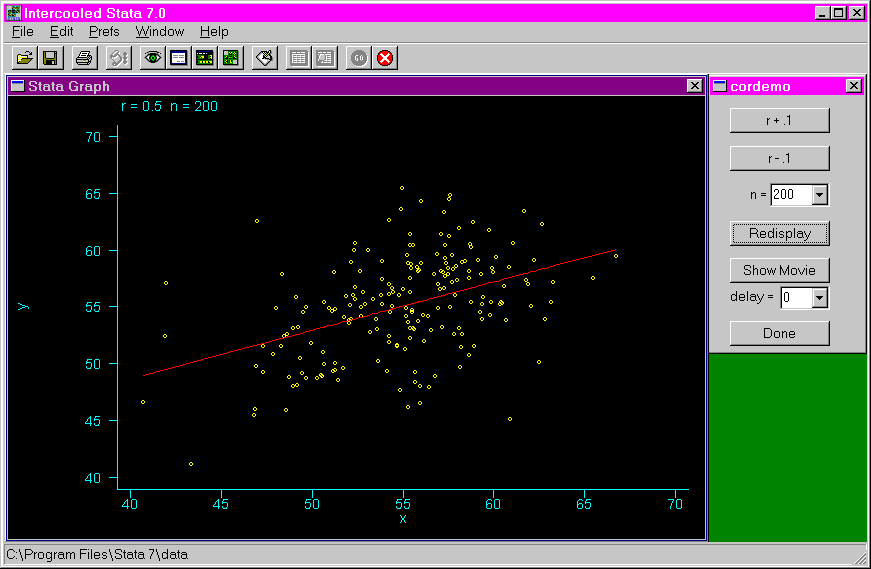
The following examples shows the effect of increasing the correlation to +.5 and the sample size to 200.

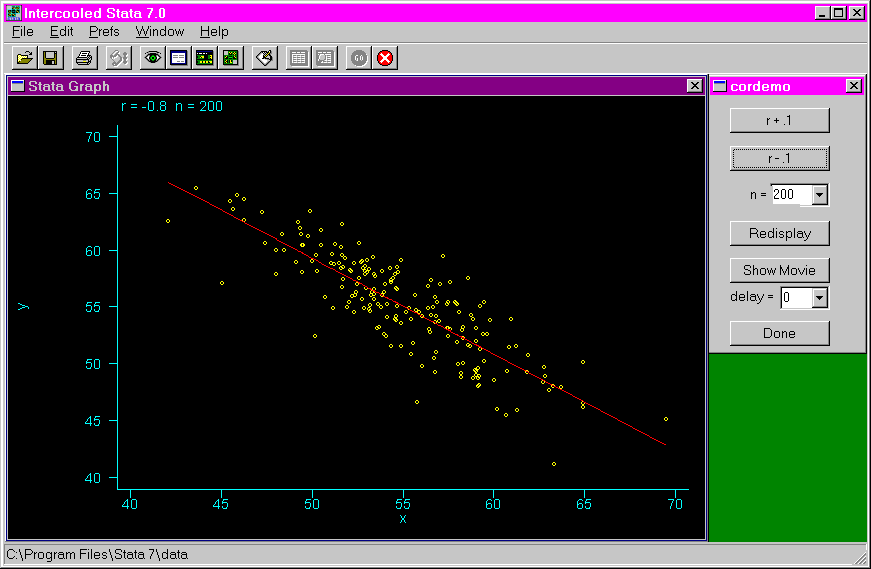
The following shows the results of decreasing the correlation to -.8.

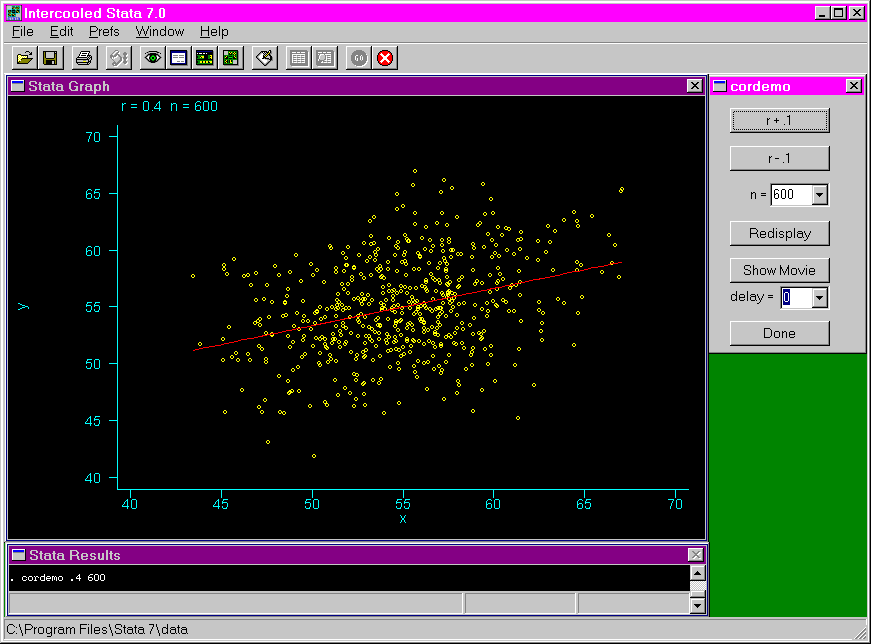
The following shows the results of issuing the cordemo command with the options of specifying the correlation (.4) and sample size (600).

