Purpose: The purpose of this program is to simulate the rolling of dice to observe the effect on the frequency distribution of the sum of the dots showing on the dice. This program is useful for illustrating the as the number of trials increases, the distribution becomes a normal distribution. The user can vary the number of rolls of the dice, the number of dice rolled and the number of sides the dice have. An option allows the data generated by the program to be saved.
Download: You can download this program from within Stata by typing
net from https://stats.idre.ucla.edu/stat/stata/ado/teach
net install dice2
Use of program: To use this program, type dice2 # in the Stata command window, where the number indices the number of rolls of the dice. By default, two dice are rolled. The user can alter this by typing a second number after the dice2 # command, which indicates the desired number of dice to be rolled. By default, the dice are assumed to have six sides. To alter the number of sides of the dice, type the desired number of sides as the third number after the dice2 command. The data generated by the program can be saved by using the save option. This is placed after a comma. Note that any data that is in Stata’s memory when the dice2 command is issued will be cleared.
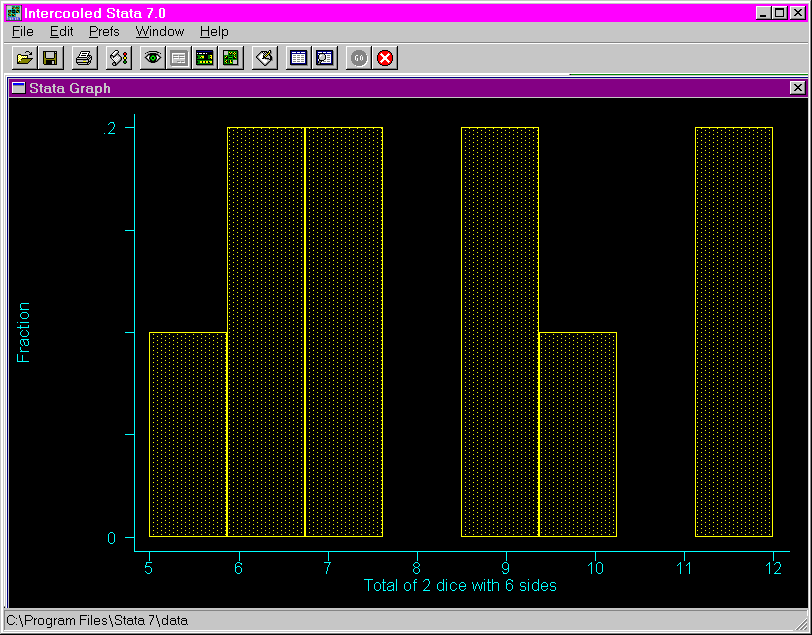
Examples: The following example shows the output from issuing the dice2 command using 10 rolls of the dice.

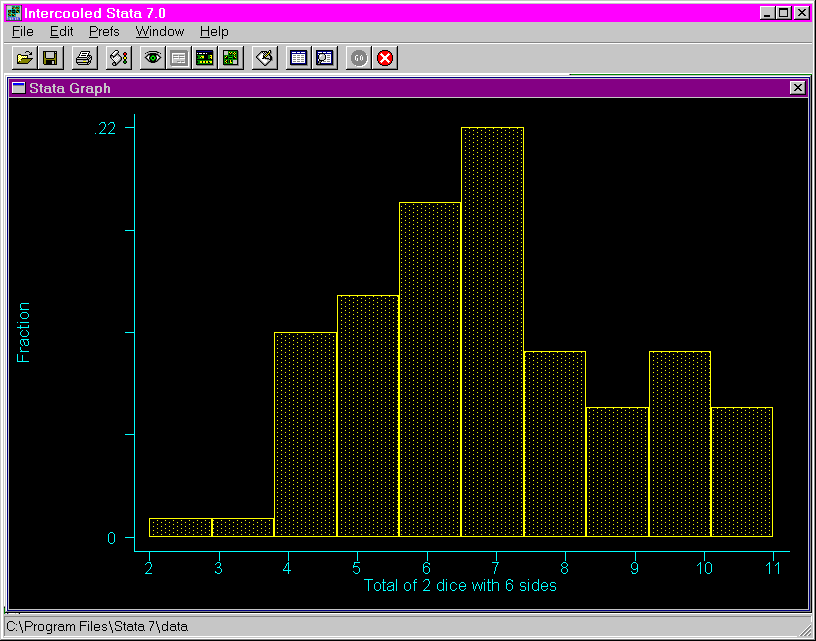
The following shows the output from issuing the dice2 command using 100 rolls of the dice. Notice that with the increased number of rolls, the distribution more closely approximates a normal distribution.

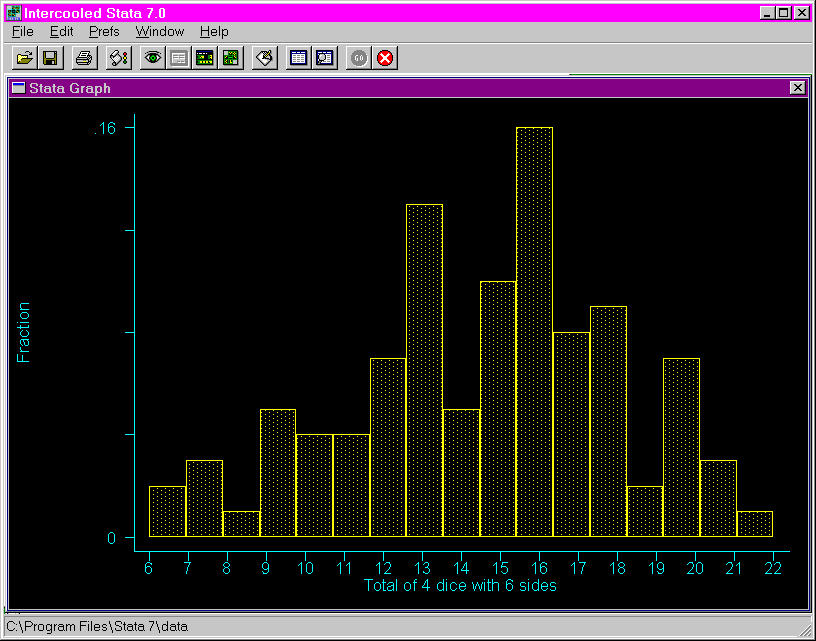
The following shows the output from issuing the dice2 command using 100 rolls of the dice and four dice.

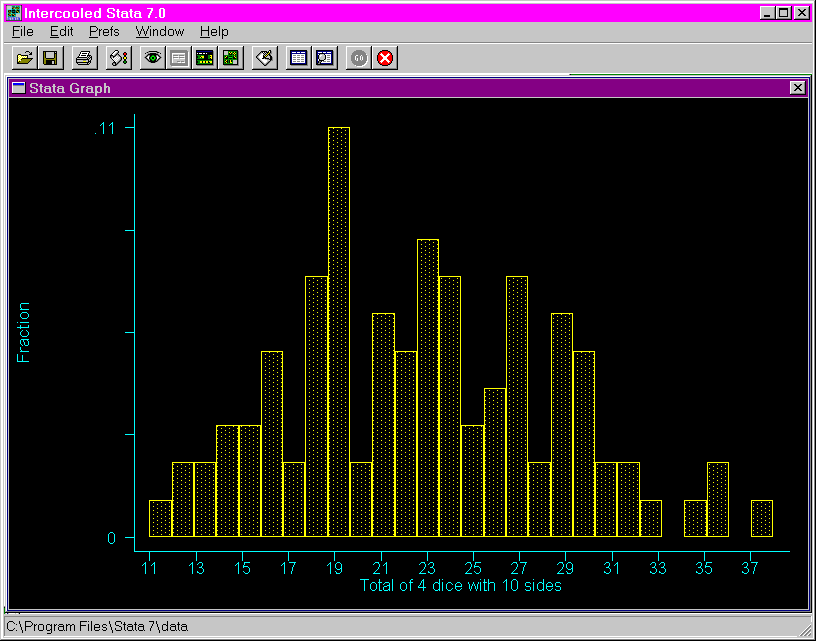
The following shows the output from issuing the dice2 command using 100 rolls of the dice and four ten-sided dice.

