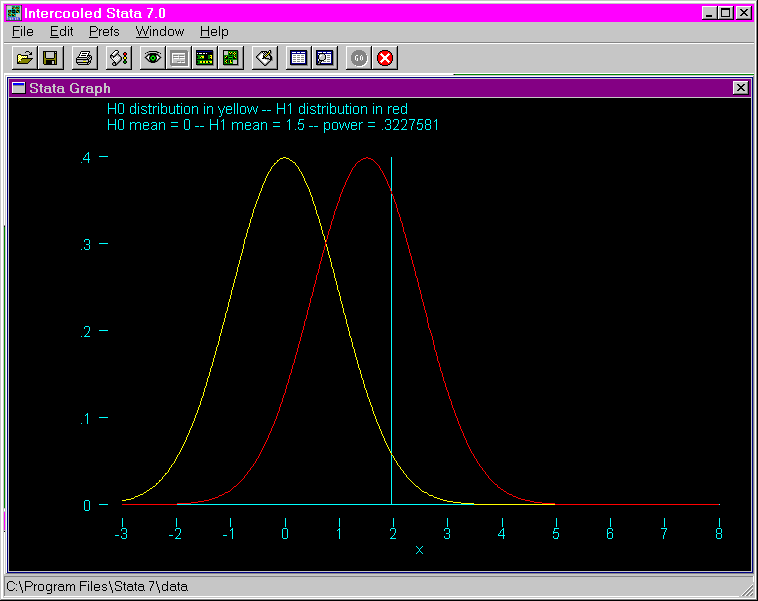
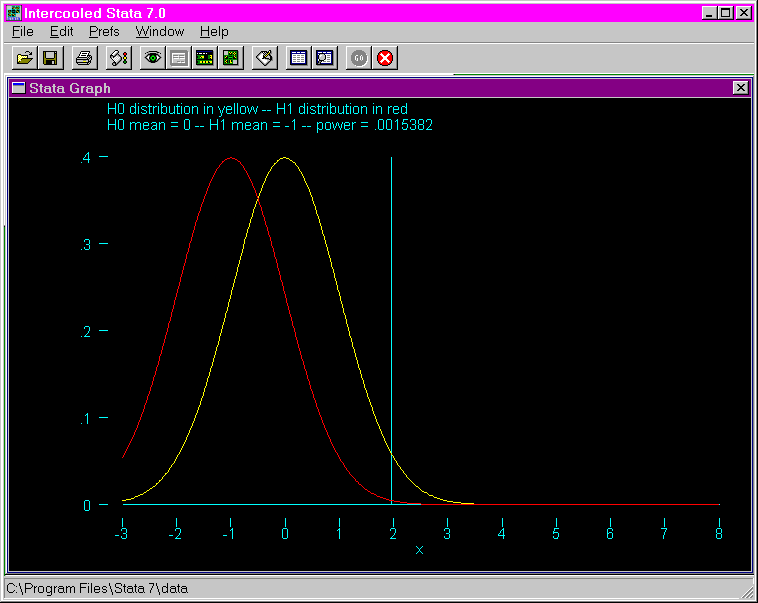
Purpose: The purpose of this program is to illustrate how the power changes as the mean for the alternative hypothesis changes. This is done by graphing the distributions for the null and the alternative hypotheses. A vertical line marks the upper tail of the null distribution at .05. Power is illustrated by the area of the alternative distribution to the right of the vertical line.
Download: You can download this program from within Stata by typing search pwrdemo (see How can I used the search command to search for programs and get additional help? for more information about using search).
Use of program: To use this program, type pwrdemo # in the Stata command window, where the number indicates the mean of the alternative distribution. Suggested values for the mean of the alternative distribution range from -1 to +5. Both the null and the alternative distributions have a standard deviation equal to one, and the null distribution has a mean of zero. The mean of the alternative distribution is supplied by the user.
Examples: The following example uses a mean of the alternative hypothesis equal to 1.5. The vertical line indicates the upper tail of the null distribution when alpha equals .05. Power is illustrated by the area of the alternative distribution (graphed in red) to the right of the line.

The following example uses a mean of the alternative hypothesis equal to -1.

