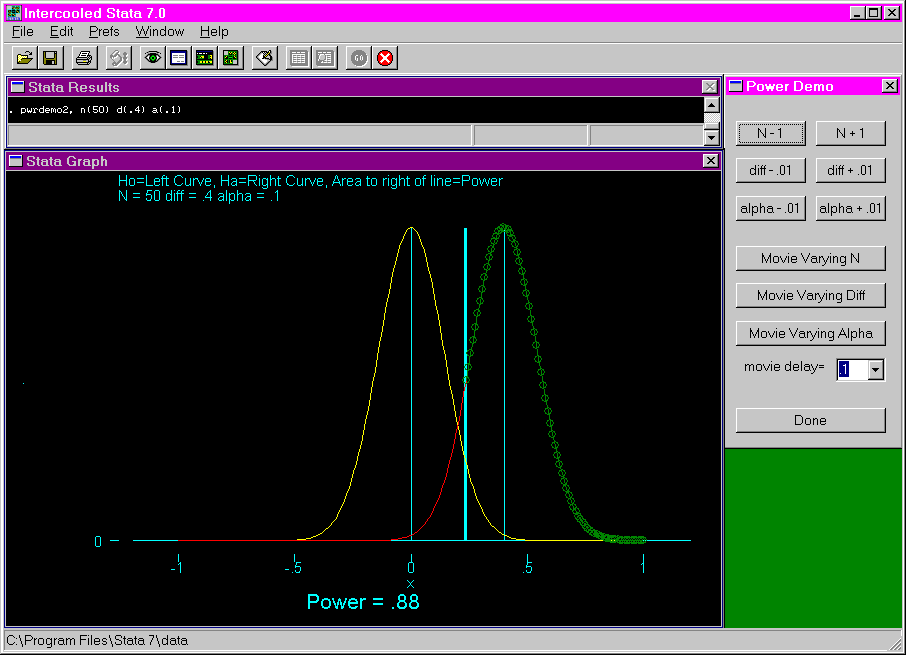
Purpose: The purpose of this program is to show curves representing the distribution of the null and alternative hypotheses and illustrating the rejection region and the area representing power. The user may select the sample size (N), the mean difference between the null and the alternative hypotheses (diff) and the level of alpha.
Download: You can download this program from within Stata by typing search pwrdemo2 (see How can I used the search command to search for programs and get additional help? for more information about using search).
Use of program: To use this program, type pwrdemo2 in the Stata command window. This opens a Stata graph window showing a curves of the null and alternative hypotheses with N = 25, diff = .25 and alpha = 05. The pwrdemo2 command also opens a dialogue window through which the user can modify the settings. Buttons allow the user to add or subtract one from N and .01 from the mean difference and alpha. Movies showing the effect of increasing values of N, diff and alpha are available by clicking on the corresponding button. A pull-down menu allows the user to control the speed of the frames of the movie. This can be done by clicking on the down-arrow to the right of "movie delay = ". The higher the number, the slower the movie. To exit the program, click on the "done" button.
The appearance of the opening graph can be altered in the command syntax. After typing pwrdemo2, in the Stata command window, the following options may be added: n(#), to change the sample size; d(#), to change the mean difference; a(#), to change the level of alpha; nodialog, to suppress the display of the dialogue window; t1( ), to include a title on the graph; t2( ), to include a second title on the graph; and l( ) to include a title on the left. Please note that a comma must by placed between the pwrdemo2 command and any options listed.
Examples: The following shows the output from issuing the pwrdemo2 command.
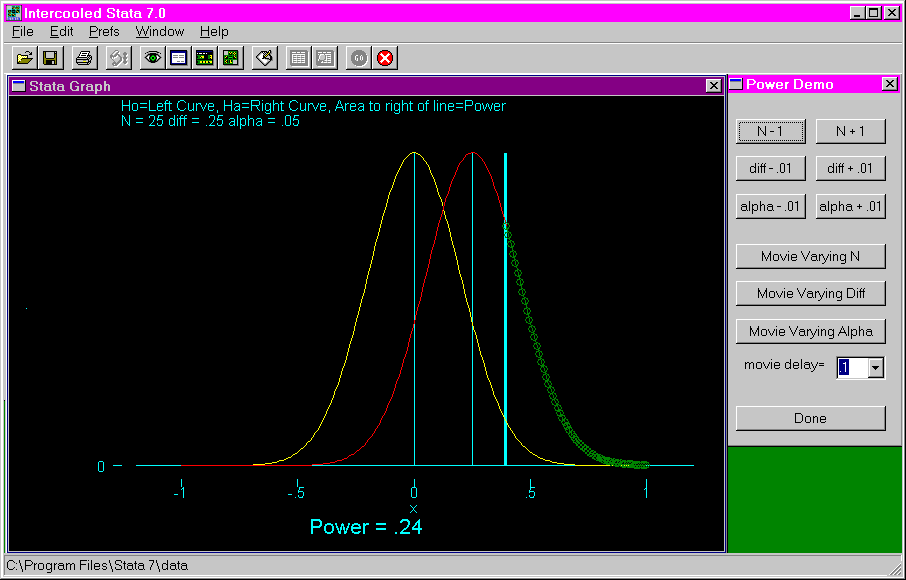
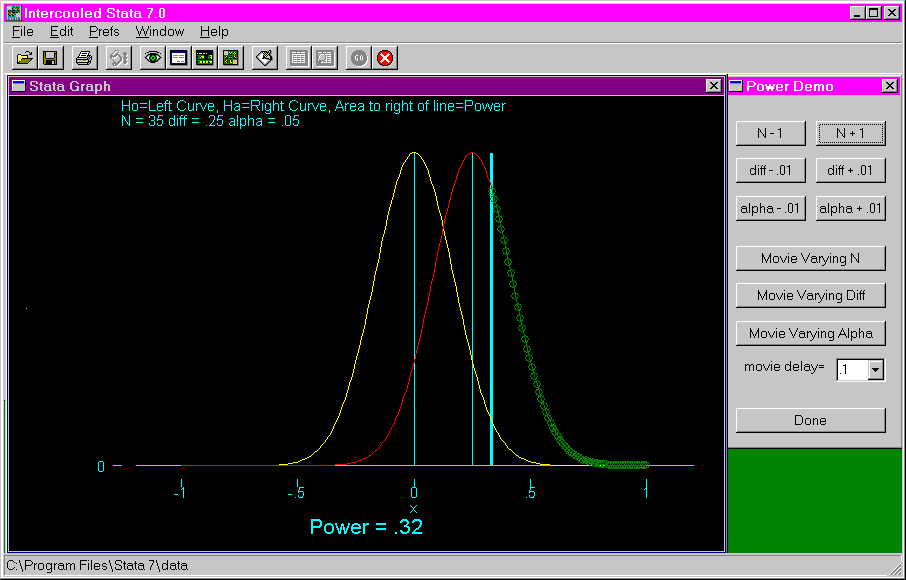
The following shows the output after increasing the sample size (N) by ten. Notice that the thick blue line has moved to the right and that the power has increased from .24 to .32.
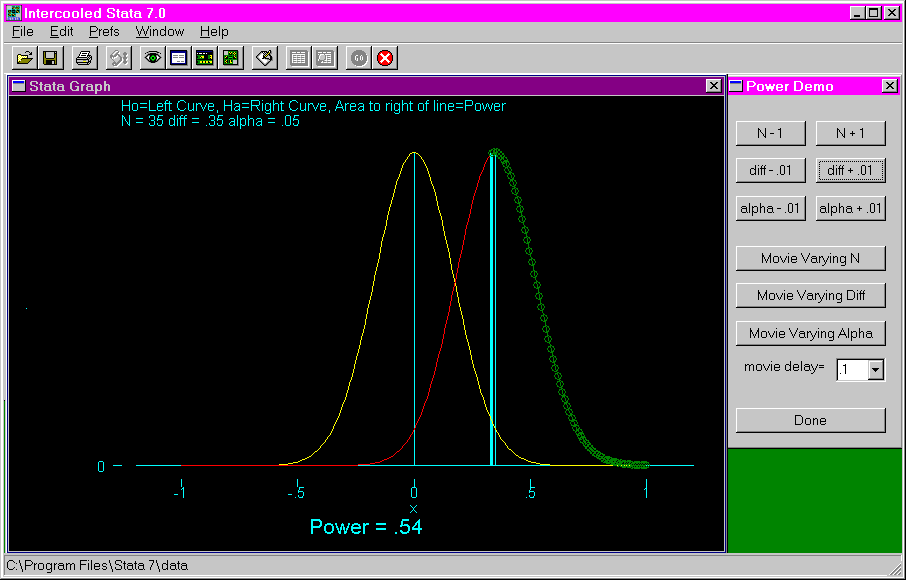
The following shows the output after increasing the mean difference by 1. Notice that the curve representing the alternative hypothesis, Ha, has moved to the right and that the power has increased from .32 to .54.
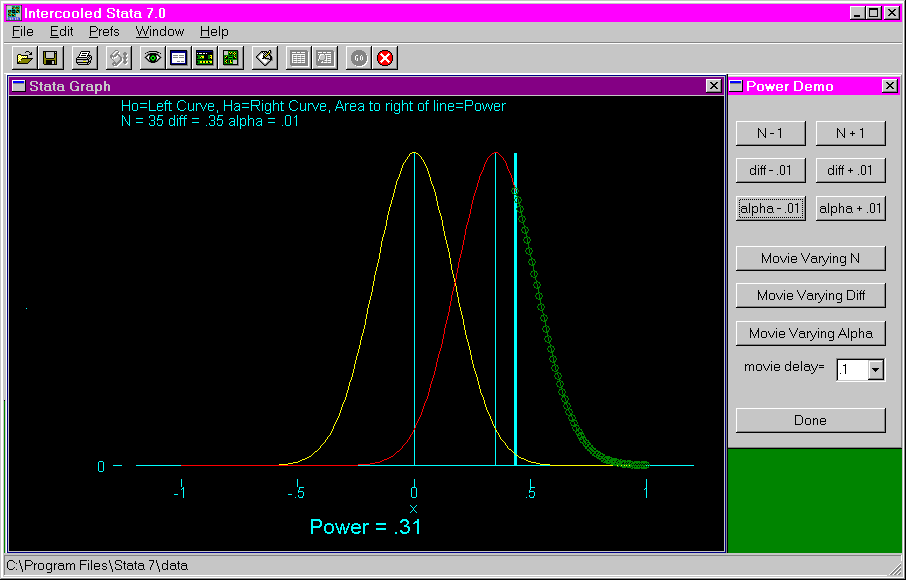
The following show the output after decreasing alpha to .01. Notice that the power has decreased from .54 to .31.
The following shows the output after issuing the pwrdemo2 command with options to set the sample size to 50, the mean difference to .4 and alpha to .1.
