Purpose: The purpose of this program is to simulate the tossing of a coin or coins and to display the results in the form of a graph with the probability of heads versus the number of trials. Options allow the user to alter the probability of obtaining heads and to display the 95% confidence interval on the graph. This program is useful for demonstrating the law of large numbers, in that as the number of trials increases, the mean probability of heads approaches the expected mean.
Download: You can download this program from within Stata by typing
net from https://stats.idre.ucla.edu/stat/stata/ado/teach
net install heads2
Use of program: To use this program, type heads2 # in the Stata command window, where the number indicates the desired number of coin tosses. By default, the probability of heads is .5. This can be changed by typing the new probability after the number of tosses. By default, one coin is tossed. To alter this, type the desired number of coins after the probability. To view the 95% confidence interval, type ci. The noclear option should be used if data that should not be lost is currently loaded into Stata. An option of suppressing the graph is also available by typing nograph. This is useful when only the data generated by the program is desired. Note that the options ci, noclear and nograph are typed after a comma.
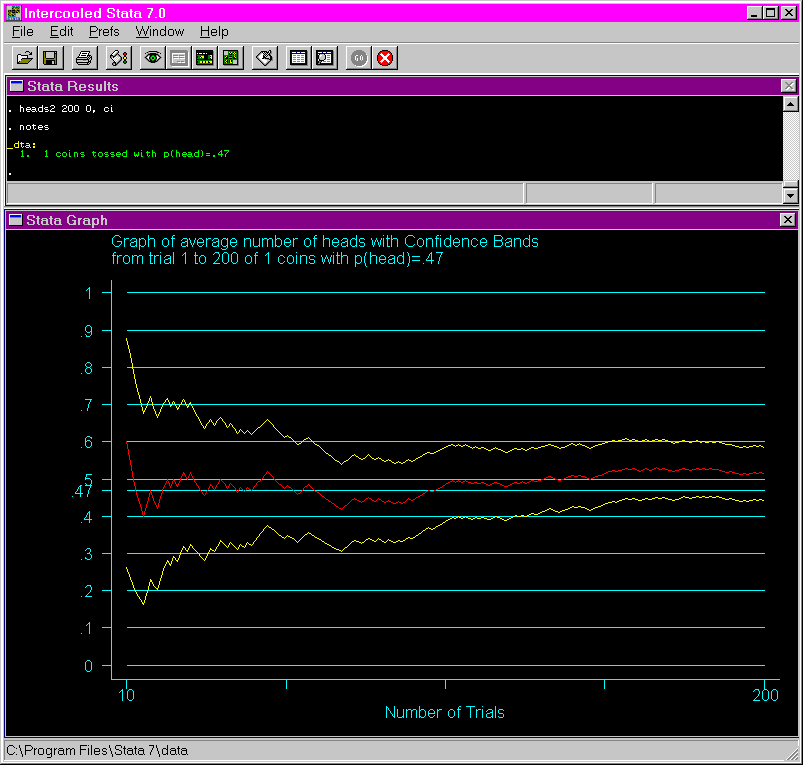
Another use of this program allows for the more realistic case of when one does not know the actual probability of the event. To simulate this situation, select a probability of zero. The program will randomly select a probability. When the ci option is used with the probability of zero, one can see what range of values are being enclosed by the confidence interval, and as the number of trial increases, what the likely selected value was. To see this value, type notes in the Stata command window. This is illustrated in the last example on this page.
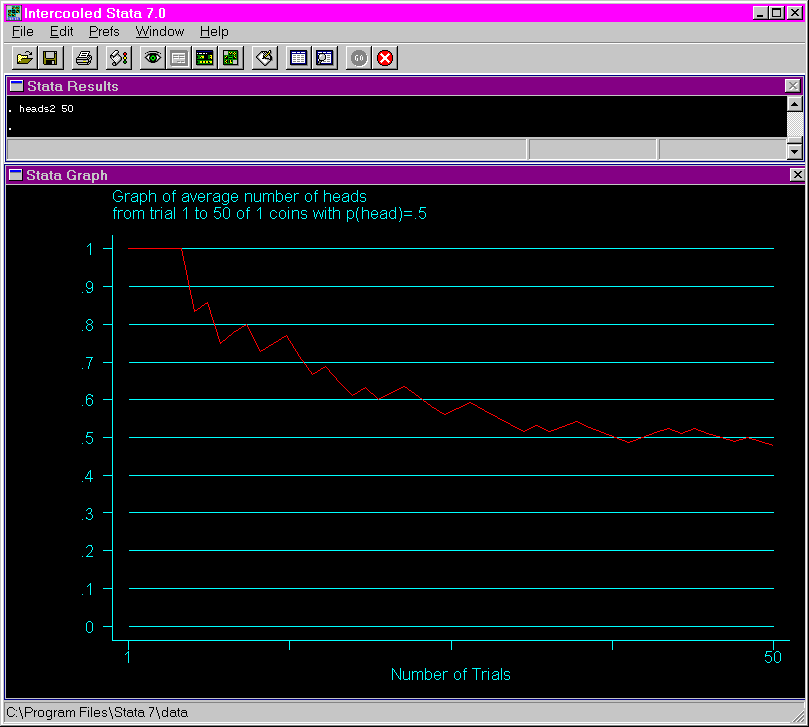
Examples: The following shows the output from issuing the heads2 using 50 tosses of the coin. Note that as the number of trials increases, the mean probability approaches .5, which is the expected probability of obtaining heads (assuming that a fair coin is being used).
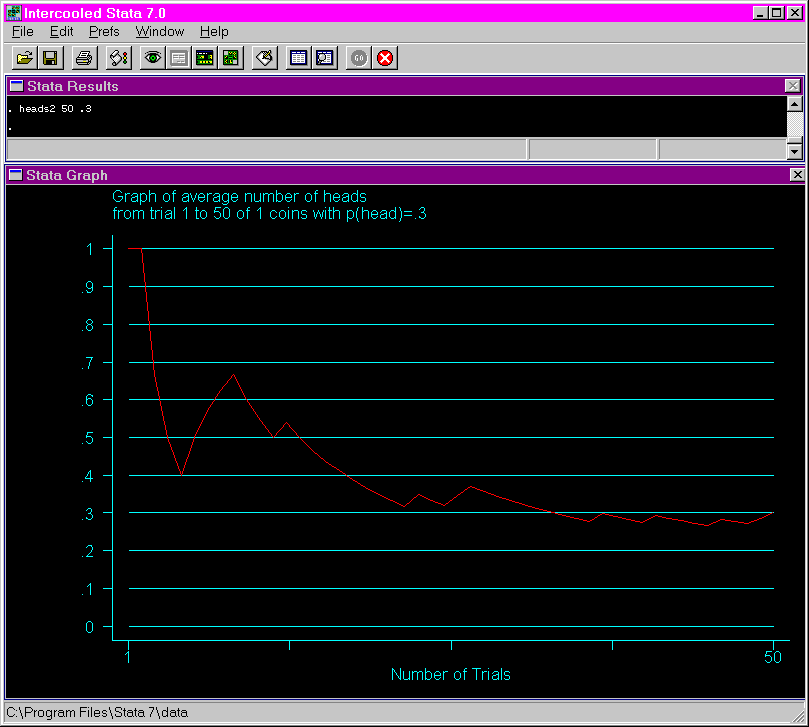
The following shows the output from issuing the heads2 using 50 tosses of the coin and a probability of .3. Notice that as the number of trials increases, the mean probability approaches .3.
The following shows the output from issuing the heads2 using 50 tosses, a probability of .3 and five coins.
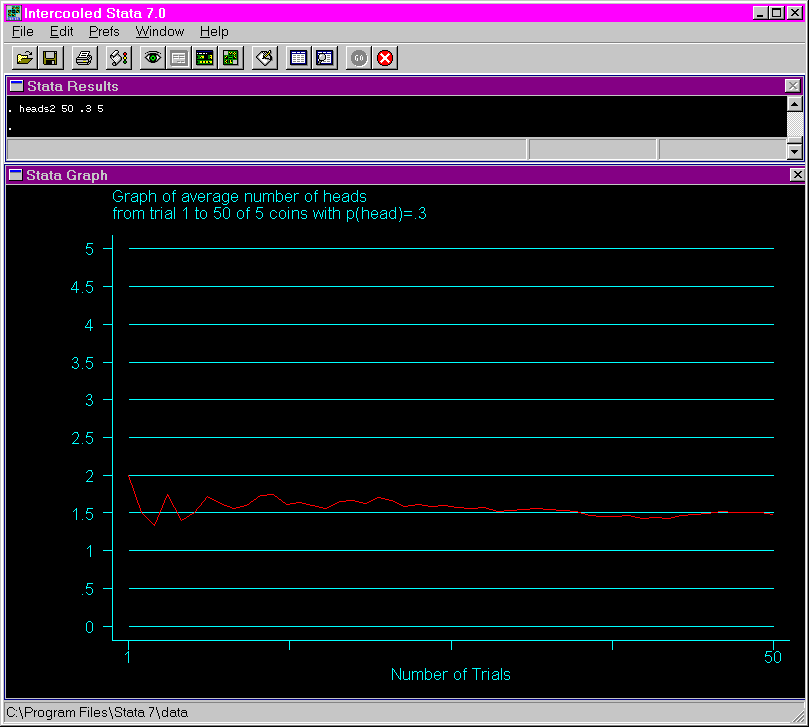
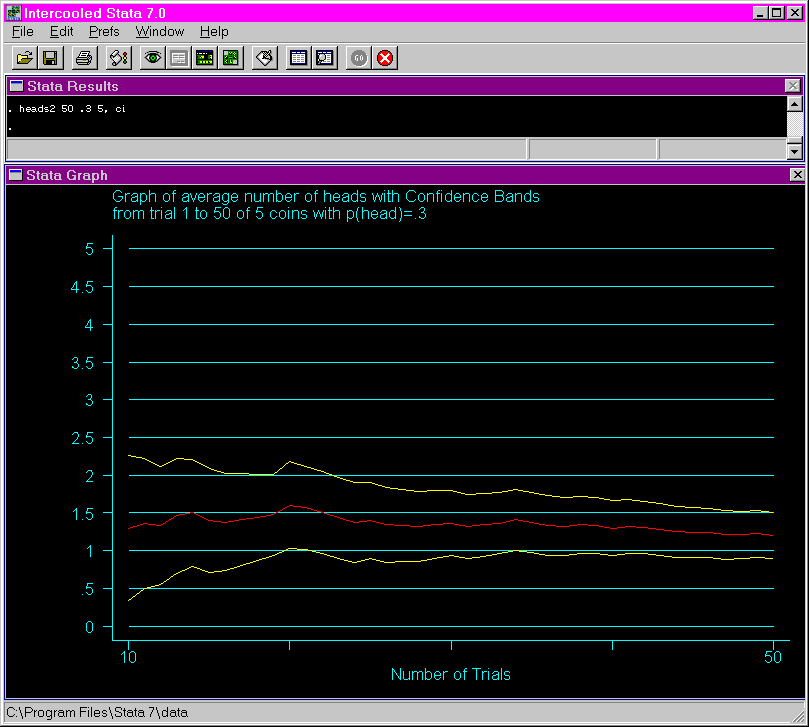
The following shows the output from issuing the heads2 using 50 tosses, a probability of .3, five coins and the ci option. Notice that the width of the confidence interval narrows as the number of trials increases.
The following shows the output from issuing the heads2 using 200 tosses, a probability of 0 and the ci option. Notice how the confidence interval narrows around the probability selected by the program (.47) as the number of trials increases.
