Purpose: The purpose of this program is to simulate the rolling of dice to observe the effect on the frequency distribution of the sum of the dots showing on the dice. This program is useful for illustrating that as the number of trials increases, the distribution becomes a normal distribution. The user can vary the number of rolls of the dice, the number of dice rolled and the number of sides the dice have.
Download: You can download this program from within Stata by typing search dice (see How can I used the search command to search for programs and get additional help? for more information about using search).
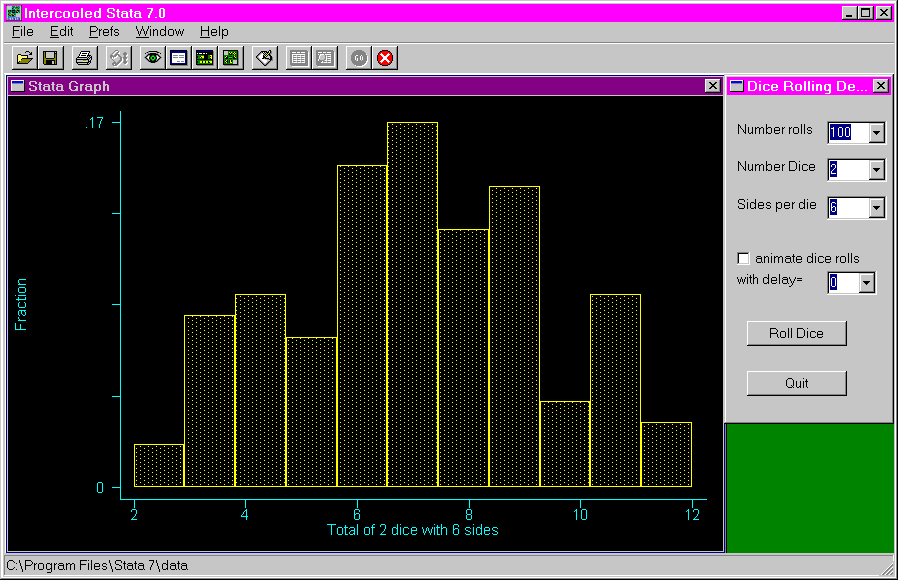
Use of program: To use this program, type dice in the Stata command window. This opens a dialogue window where the user can select the number of rolls of the dice, the number of dice rolled and the number of sides that the dice have. By default, two dice with six sides are rolled 100 times. A Stata graph window is also opened when the dice command is issued, showing a histogram of the relative frequency ("Fraction") of the number of dots of the dice showing. After making the desired selections, the user needs to click on the "roll dice" button to have the results of the selections show on the histogram. A check-box allows the user to animate the building of the histogram. A pull-down menu allows the user to control the speed of the frames of the animation. This can be done by clicking on the down-arrow to the right of "with delay = ". The higher the number, the slower the animation. To exit the program, click on the "Quit" button.
Examples: The following example shows the output from issuing the dice command.

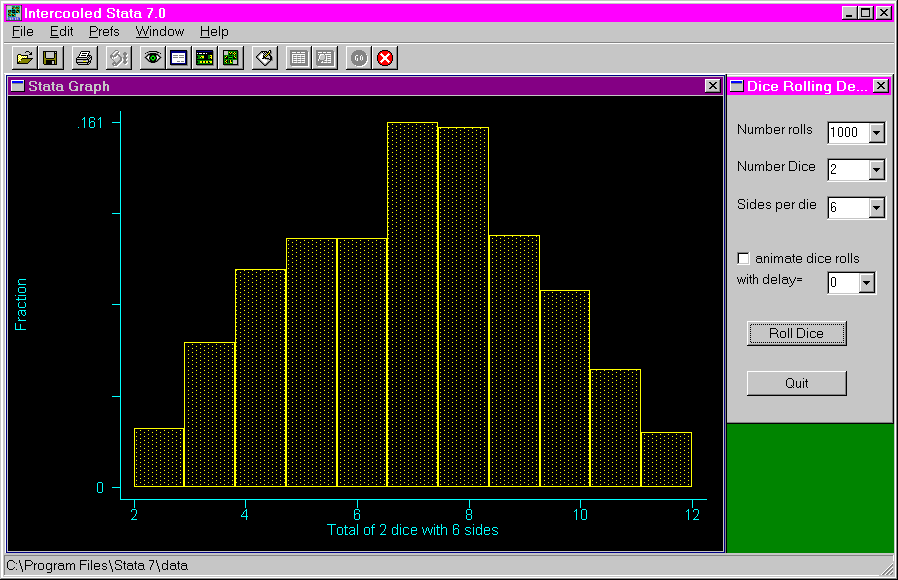
The following shows the results of rolling the dice 1000 times. Notice that with the increased number of rolls, the distribution more closely approximates a normal distribution.

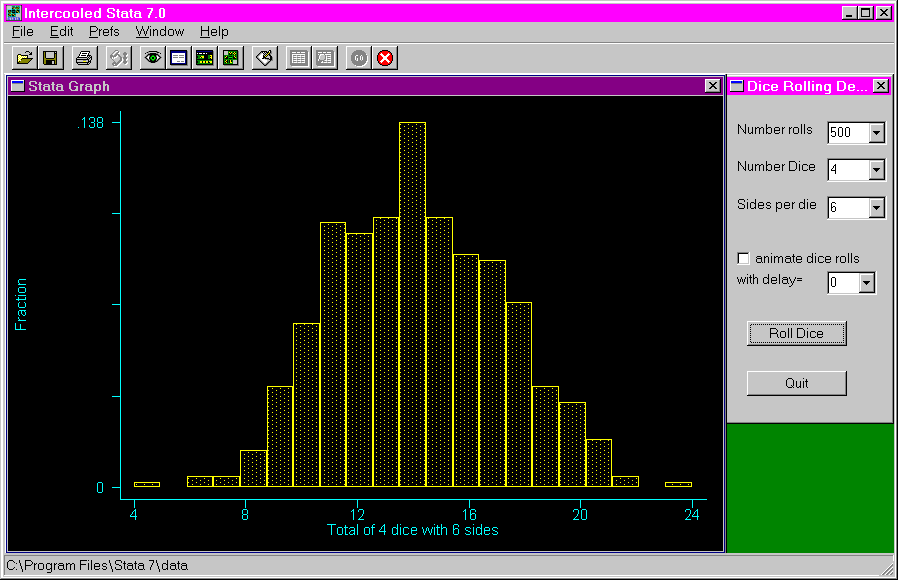
The following shows the results of rolling four dice 500 times.

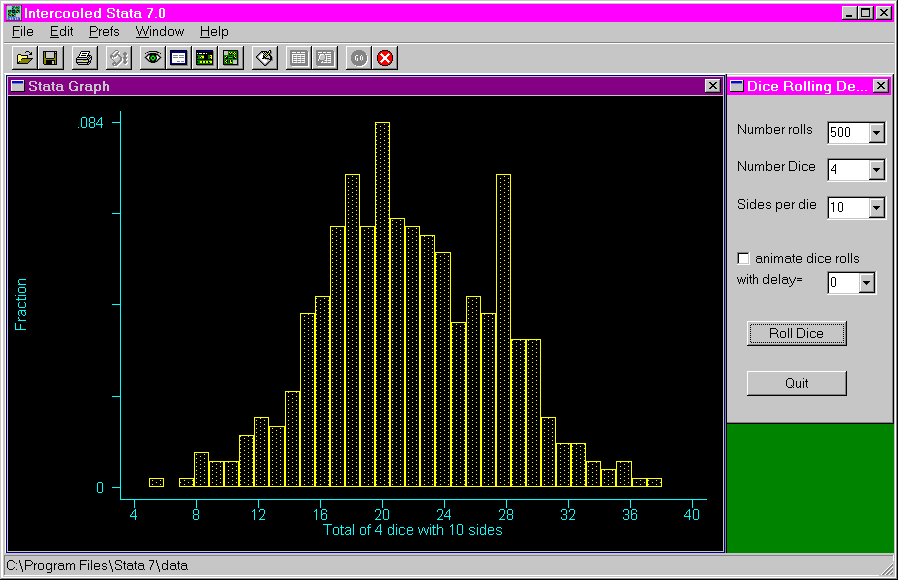
The following shows the results of rolling four dice with ten sides 500 times.

