Purpose: The purpose of this program is to show the effect of a change in the slope, the constant (i.e., the intercept) or a point (x) on the regression line. The equation resulting equation is also displayed.
Download: You can download this program from within Stata by typing search grolsw (see How can I used the search command to search for programs and get additional help? for more information about using search).
Use of program: To use this program, type grolsw in the Stata command window. Nine buttons govern the use of the program. One can be added or subtracted from either a (the intercept) or x (the point), and .1 can be added or subtracted from b (the slope). Pressing the "done" button will exit the user from the program (but not from Stata). The red box indicates the point that can be moved (x).
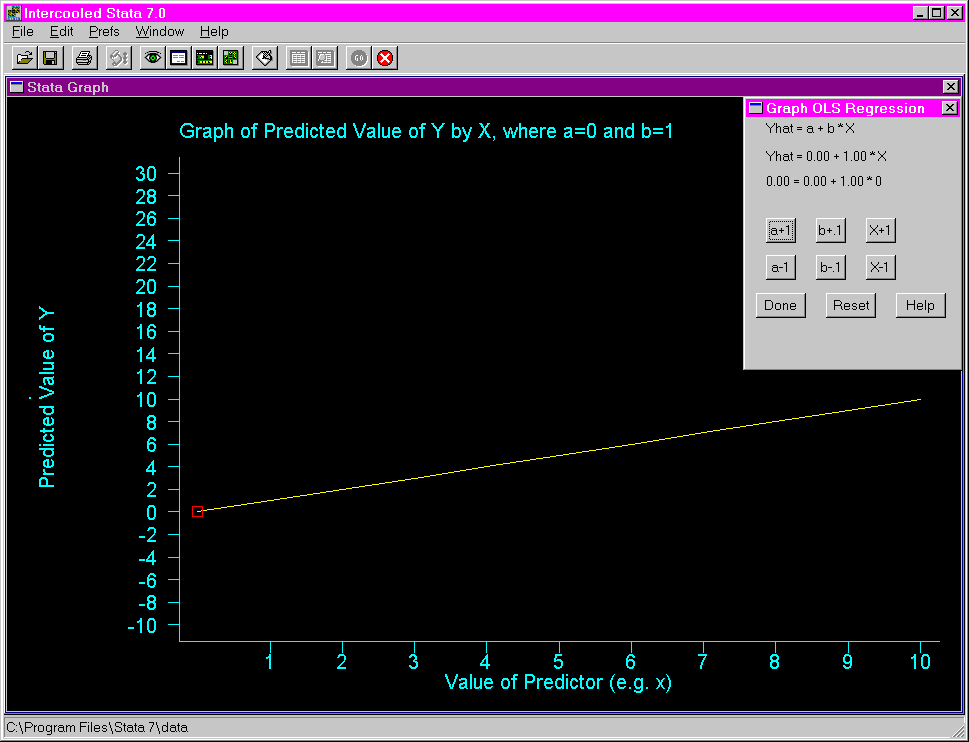
Examples: The following shows the first screen of the grolsw program. From here, any of the nine buttons can be pressed.

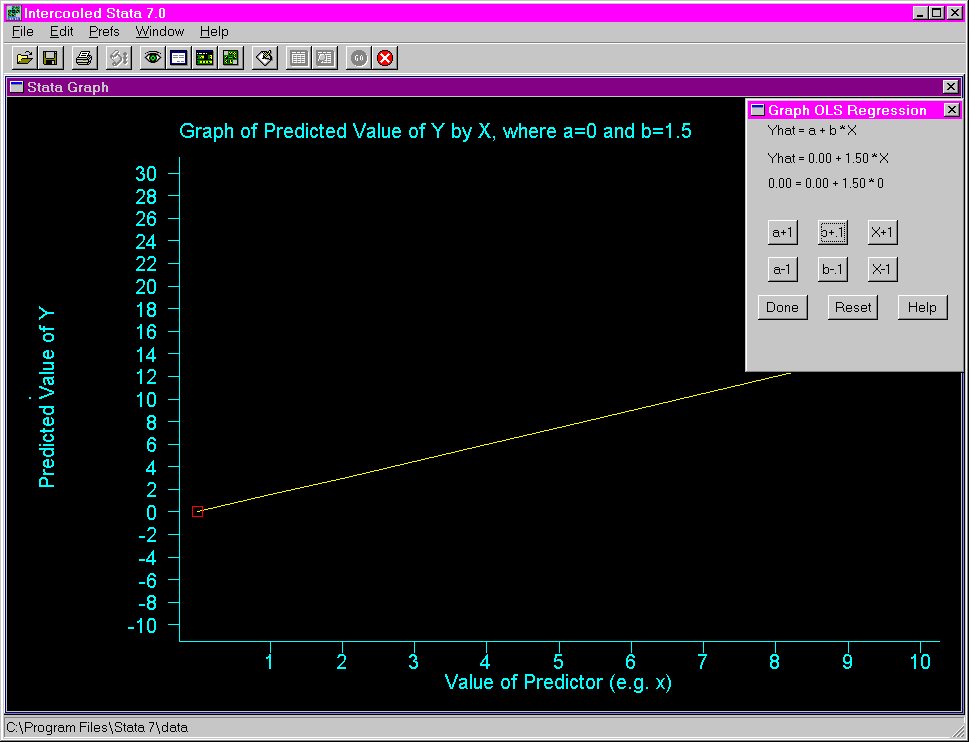
The following shows the results of pressing the "b – .1" button five times. Notice that the slope is steeper and that the changes are indicated in the equations at the top of command box.

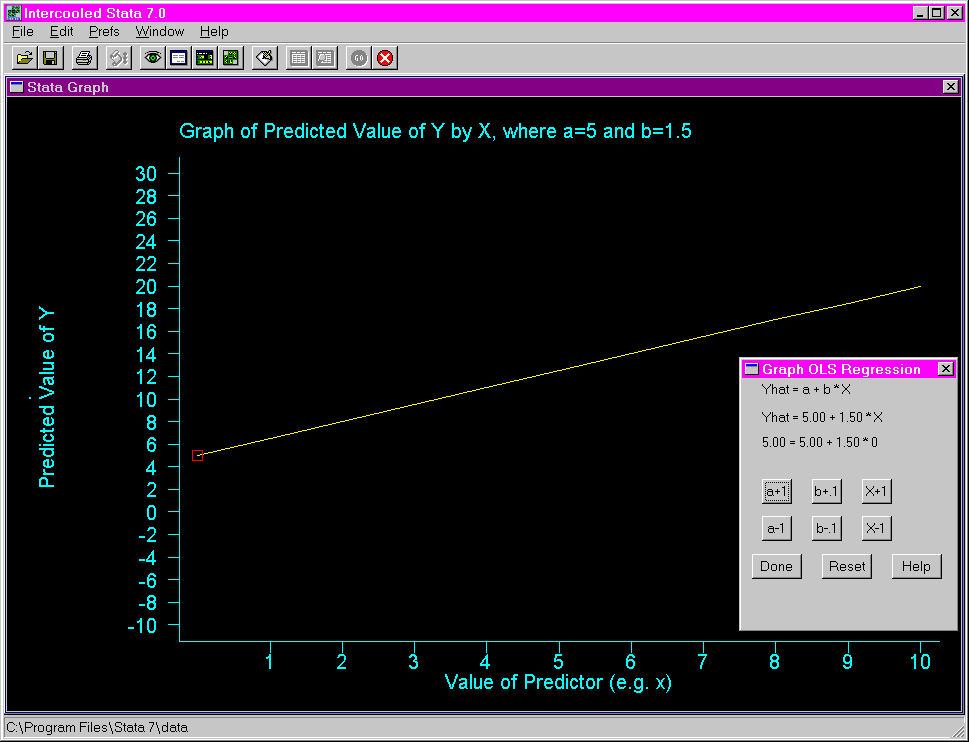
The following shows the results of pressing the "a + 1" button five
times. Notice that the intercept has moved up on the
y axis five units.

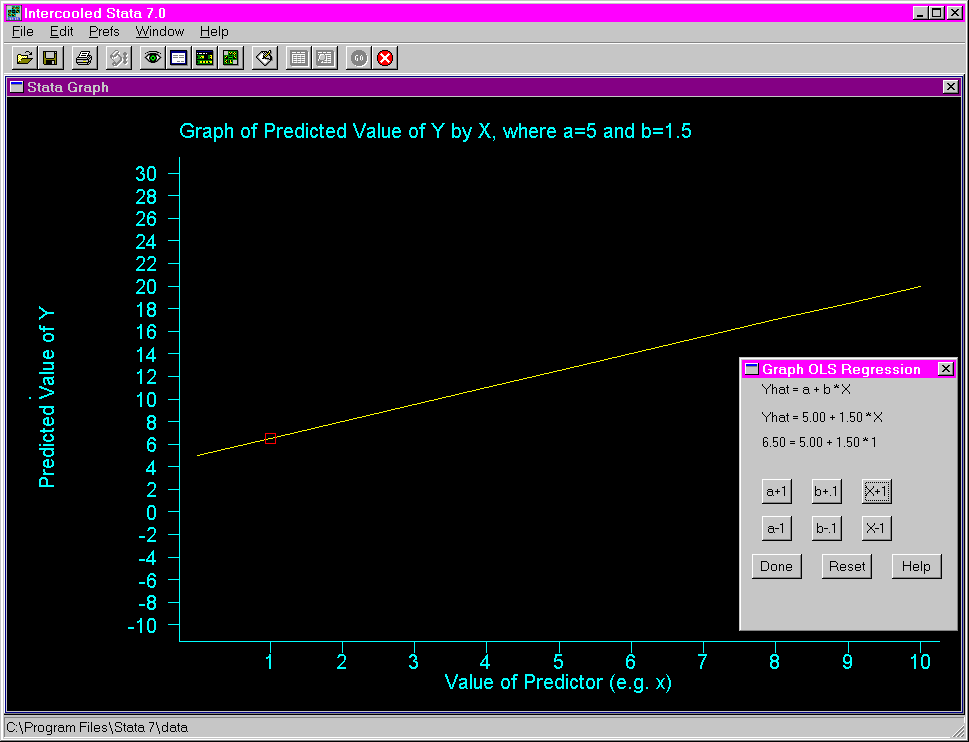
The following shows the results of pressing the "x + 1" button
once. Notice that the moving point, displayed as the red box,
has moved to the right one unit. Also notice that the predicted value
increased by 1.5 because the slope is 1.5.

