Purpose: The of this program is to show how changing one (point or value) in a sample affects the various statistics that describe the sample. This program can be used to illustrate that some descriptive statistics, such as the mean and standard deviation, change as the value of the "moving point" changes. On the other hand, descriptive statistics such as the median, minimum and maximum may or may not change as the value of the "moving point" changes.
Download: You can download this program from within Stata by typing search meanpt (see How can I used the search command to search for programs and get additional help? for more information about using search).
Use of program: To run this program, type meanpt in the Stata command window. There are no options available with this program. There are 26 points in the sample, one of which can be moved by clicking on either the "x + 1" or "x – 1" buttons. The vertical line indicates the mean of the distribution. The value of the "moving point" (labeled mp) is given at the top of the screen, as is the mean, standard deviation, minimum and maximum. The "moving point" is the one in the red box. A new sample can be drawn by clicking on the "New Samp" button. Click on the "Done" button to exit the program.
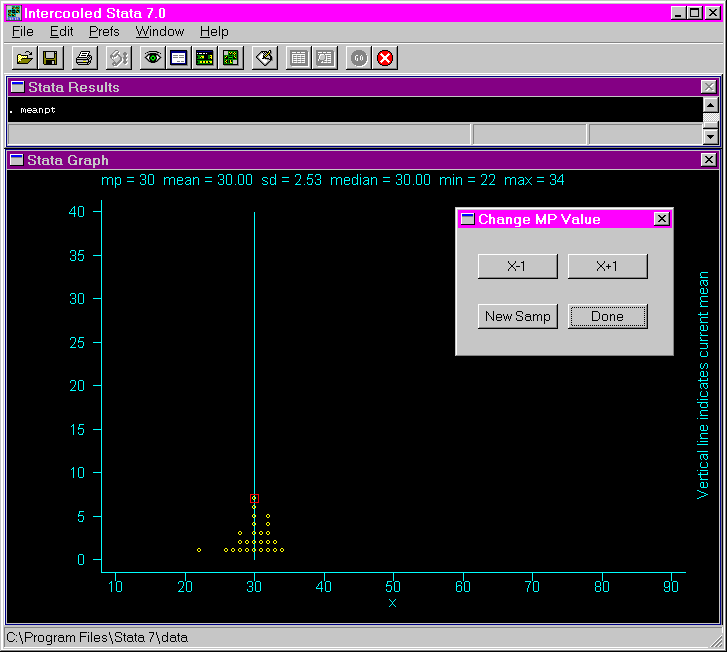
Examples: This shows the initial screen after issuing the meanpt command.

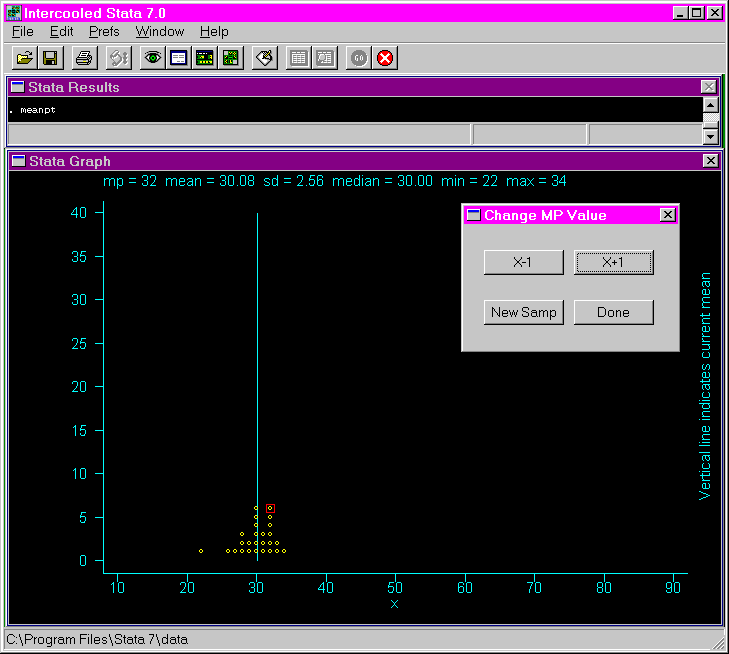
This shows the results after clicking on the "x + 1" button twice. As you can see, the mean and the standard deviation have changed a little, but the median, minimum and maximum have not changed.

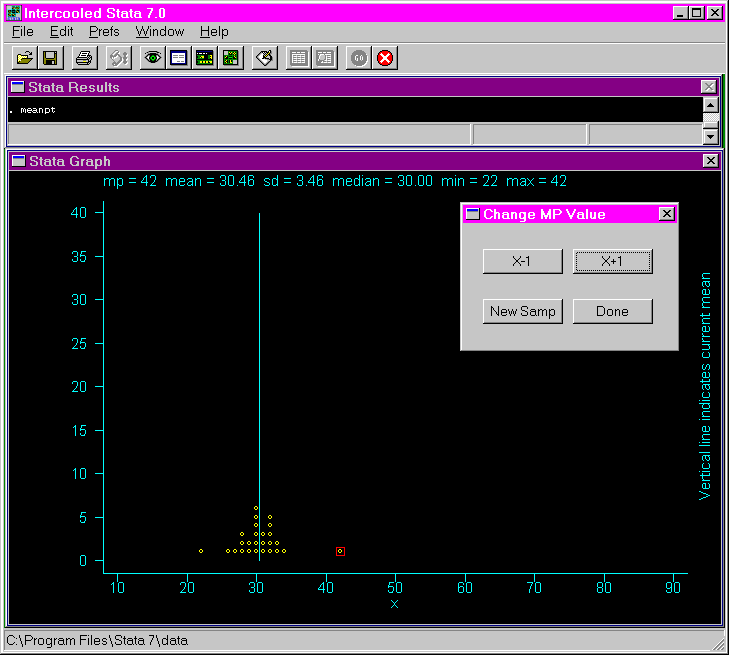
This is the result of clicking on the "x + 1" button another ten times. Again, the mean and the standard deviation have increased, and now so has the maximum. However, the median and the minimum remain the same.

