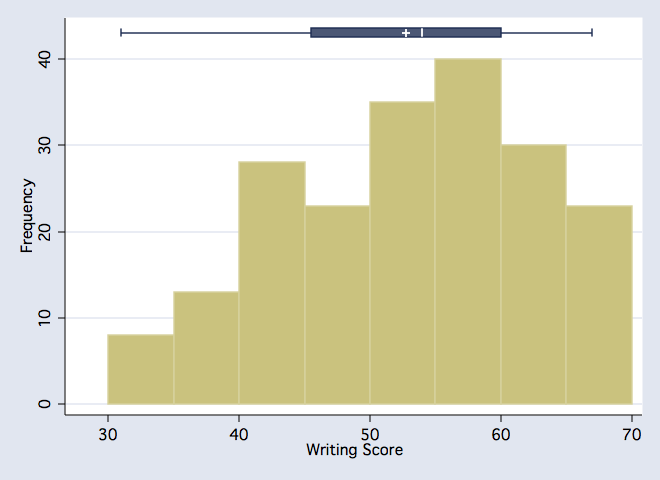
This page presents a code fragment for producing a graph combining a histogram with a boxplot. There is also a Stata FAQ page on the histbox ado program.
use hsb2, clear

* get values for boxplot
summarize write, d
gen f=43             /* set value a little larger than bin with highest frequency */
gen pmin=r(min)
gen p25=r(p25)
gen p50=r(p50)
gen p75=r(p75)
gen pmax=r(max)
gen pmean=r(mean)

* graph histogram and boxplot on same axes
two (histogram write, start(30) width(5) freq)                  ///
    (rcap pmin pmax f in 1, hor bcolor(dknavy))                 ///
    (rbar p25 p75 f in 1, hor bcolor(dknavy))                   ///
    (rcap p50 p50 f in 1, hor bcolor(white))                    ///
    (rcapsym pmean pmean f in 1, hor msym(plus) mcolor(white)), ///
    legend(off) xtitle("Writing Score") ytitle("Frequency")

* drop variables created for boxplot values
drop f-pmean