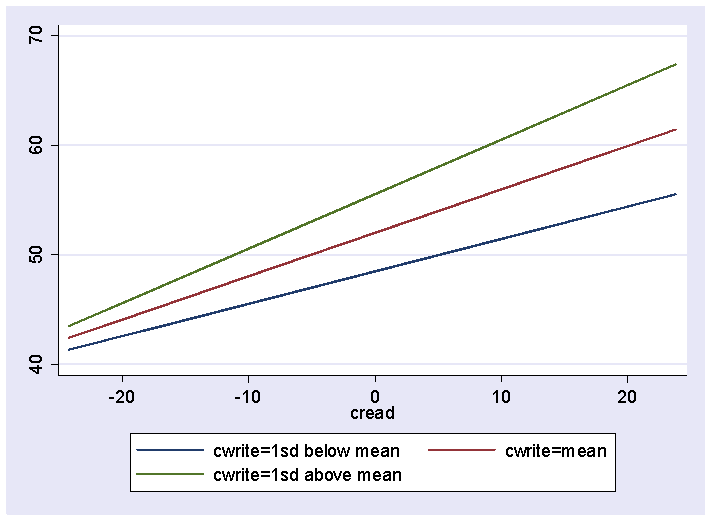
This example uses the hsb2 data file to illustrate how to graph an interaction of two continuous variables. This is based on the techniques illustrated in these books.
- Multiple Regression: Testing and Interpreting Interactions by Leona S. Aiken and Steven G. West.
- Interaction Effects in Multiple Regression by James Jaccard, Robert Turrisi and Choi K. Wan.
This example uses xi3, postgr3 and spostado, which you can obtain using the search command, e.g., search xi3, search postgr3 and search spostado. It is important that you download all three of these packages before these tools will work. (see How can I use the search command to search for programs and get additional help? for more information about using search).
use https://stats.idre.ucla.edu/stat/stata/notes/hsb2
* center predictors read and write
summarize read
generate cread = read - r(mean)
summarize write
generate cwrite = write - r(mean)

* create interaction term
gen rw = cread*cwrite

* do regression
xi3: regress math cread cwrite rw

* get mean and sd for computing 1sd below mean, mean, 1sd above mean
summarize cwrite
local mwrite  = r(mean)
local sdwrite = r(sd)

* create "yhat1", predicted values at 1sd below mean
local write_at = `mwrite'-`sdwrite'
replace rw = cread*`write_at'
postgr3 cread, x(cwrite=`write_at') asis(cread rw) gen(yhat1)
label variable yhat1 "cwrite=1sd below mean"

* create "yhat2", predicted values at mean
local write_at = `mwrite'
replace rw = cread*`write_at'
postgr3 cread, x(cwrite=`write_at') asis(cread rw) gen(yhat2)
label variable yhat2 "cwrite=mean"

* create "yhat3", predicted values at 1sd above mean
local write_at = `mwrite'+`sdwrite'
replace rw = cread*`write_at'
postgr3 cread, x(cwrite=`write_at') asis(cread rw) gen(yhat3)
label variable yhat3 "cwrite=1sd above mean"

* show graph of 3 regression lines
line yhat1 yhat2 yhat3 cread

* show that slopes are right, compare to original regression
* and manually compute

* slope for cread - 9.47*slope for rw
regress yhat1 cread

* slope for cread
regress yhat2 cread

* slope for cread + 9.47*slope for rw
regress yhat3 cread
The final resulting graph is shown below.

