* lets make a data file with one Y variable and 4 yes/no variables
use hsb2, clear
gen q1 = female
gen q2 = ses == 1
gen q3 = schtyp == 1
gen q4 = prog == 1keep id q1 q2 q3 q4 read
reshape long q, i(id) j(qno)
* Now lets make "qno2" that has 1-8
generate qno2 = (qno-1)*2+q + 1
* but lets add gaps between the questions
recode qno2 (1=1) (2=2) (3=4) (4=5) (5=7) (6=8) (7=10) (8=11)
* and lets make data for the gaps
set obs 804
replace qno2 = 0 in 801
replace qno2 = 3 in 802
replace qno2 = 6 in 803
replace qno2 = 9 in 804
* and now lets label them
label define qlab 0 "Question 1" 1 "non factual" 2 "factual" 3 "Question 2" 4 "non sensitive" 5 "sensitive" 6 "Question 3" 7 "easy" 8 "difficult" 9 "Question 4" 10 "closed" 11 "open"
label values qno2 qlab
* and now we make the graph

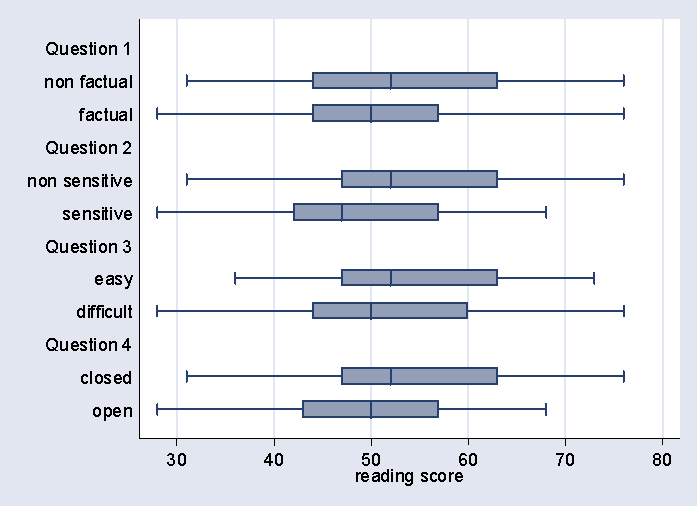
graph box read, over(qno2) hor
* and it looks like this