Table 10.1, page 327.
Note: The noadjust option suppresses the actuarial adjustment.
use https://stats.idre.ucla.edu/stat/stata/examples/alda/data/teachers, clear

generate event = ~censor
ltable t event, noadjust

                 Beg.                                 Std.
   Interval     Total   Deaths   Lost    Survival    Error     [95% Conf. Int.]
-------------------------------------------------------------------------------
    1     2      3941      456      0     0.8843    0.0051     0.8739    0.8939
    2     3      3485      384      0     0.7869    0.0065     0.7737    0.7993
    3     4      3101      359      0     0.6958    0.0073     0.6811    0.7099
    4     5      2742      295      0     0.6209    0.0077     0.6056    0.6359
    5     6      2447      218      0     0.5656    0.0079     0.5500    0.5809
    6     7      2229      184      0     0.5189    0.0080     0.5032    0.5344
    7     8      2045      123    280     0.4877    0.0080     0.4720    0.5032
    8     9      1642       79    307     0.4642    0.0080     0.4485    0.4798
    9    10      1256       53    255     0.4446    0.0081     0.4287    0.4605
   10    11       948       35    265     0.4282    0.0083     0.4120    0.4444
   11    12       648       16    241     0.4177    0.0085     0.4010    0.4342
   12    13       391        5    386     0.4123    0.0087     0.3952    0.4293
-------------------------------------------------------------------------------

ltable t event, hazard noadjust

                 Beg.     Cum.     Std.                Std.
   Interval     Total   Failure   Error    Hazard     Error    [95% Conf. Int.]
-------------------------------------------------------------------------------
    1     2      3941    0.1157  0.0051    0.1157    0.0054    0.1053    0.1266
    2     3      3485    0.2131  0.0065    0.1102    0.0056    0.0994    0.1215
    3     4      3101    0.3042  0.0073    0.1158    0.0061    0.1041    0.1280
    4     5      2742    0.3791  0.0077    0.1076    0.0063    0.0957    0.1202
    5     6      2447    0.4344  0.0079    0.0891    0.0060    0.0777    0.1013
    6     7      2229    0.4811  0.0080    0.0825    0.0061    0.0711    0.0949
    7     8      2045    0.5123  0.0080    0.0601    0.0054    0.0500    0.0712
    8     9      1642    0.5358  0.0080    0.0481    0.0054    0.0381    0.0593
    9    10      1256    0.5554  0.0081    0.0422    0.0058    0.0316    0.0543
   10    11       948    0.5718  0.0083    0.0369    0.0062    0.0257    0.0501
   11    12       648    0.5823  0.0085    0.0247    0.0062    0.0141    0.0382
   12    13       391    0.5877  0.0087    0.0128    0.0057    0.0042    0.0262
-------------------------------------------------------------------------------
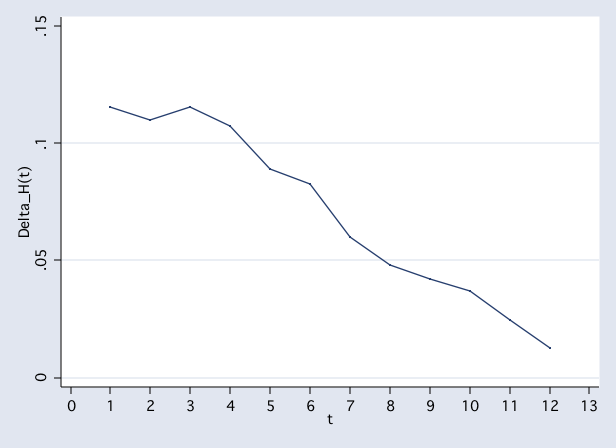
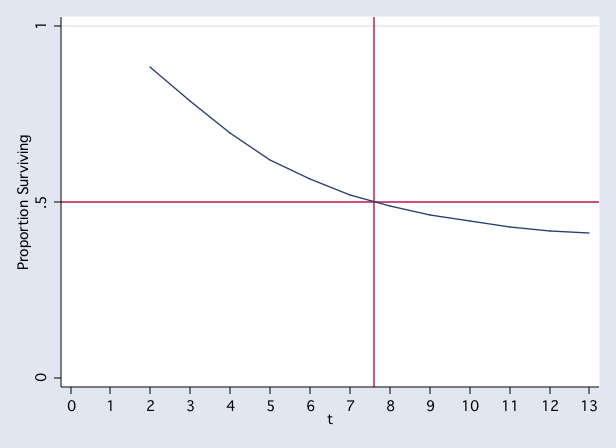
Figure 10.1, page 333.
Note: The notab option suppresses tabular display, noconf option suppresses confidence intervals on graph, xlabel specifies the values displayed on the x-axis, ylabel specifies the values displayed on the y-axis, msymbol(i) indicates that no symbol is to be used at the plotted points, yline places a horizontal line, xline places a vertical line.
Note: In the second panel the median is shifted up 1 point from the book because Stata plots the survival probabilities at the end of the time intervals.
stset t, failure(event)
sts gen h=h
graph twoway scatter h t, msymbol(i) connect(l) ylabel(0(.05).15) xlabe(0(1)13) sort
ltable t event, noadjust notab graph noconf xlabel(0(1)13) ylabel(0(.5)1) msymbol(i) yline(.5) xline(7.6)
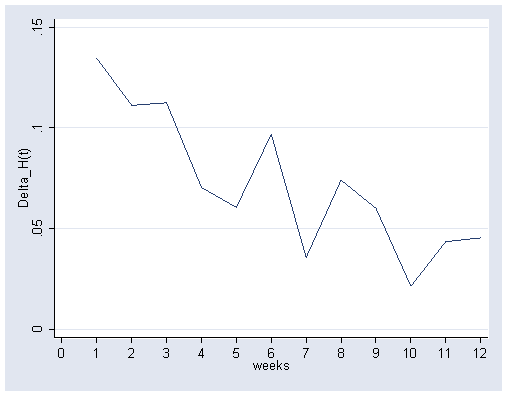
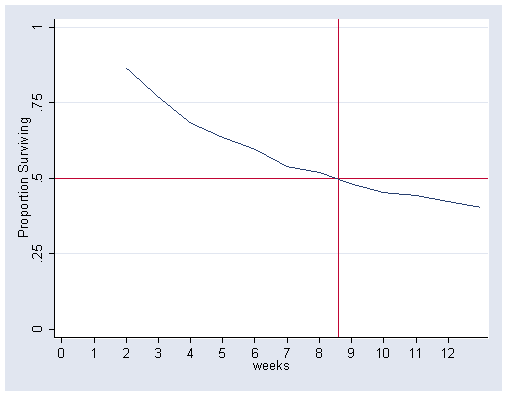
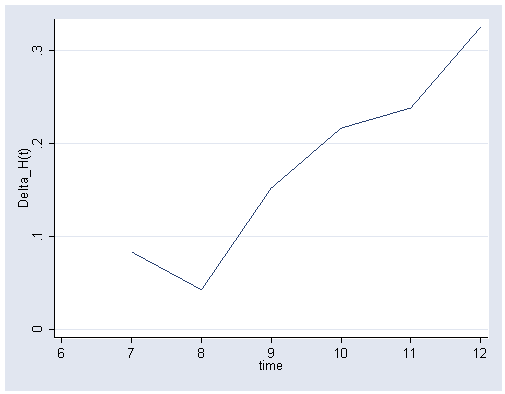
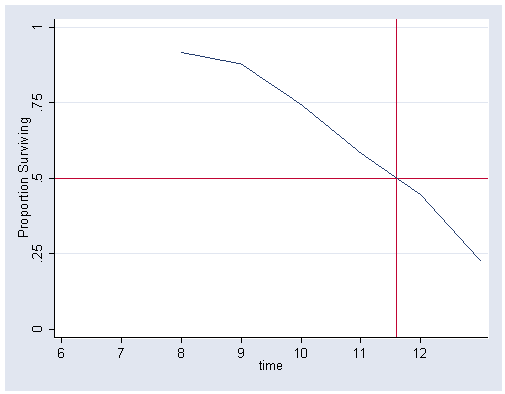
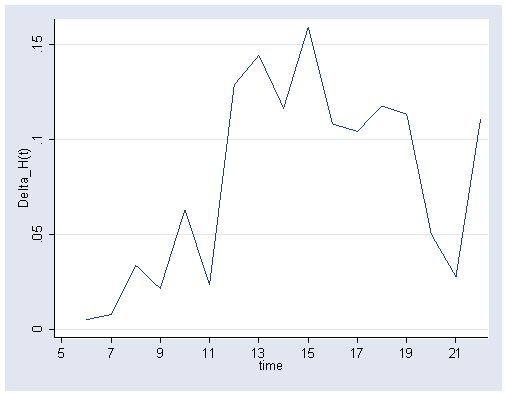
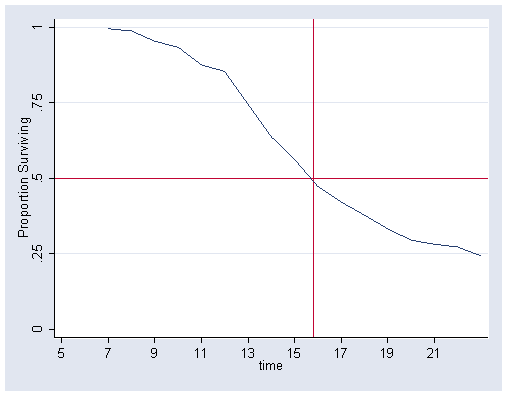
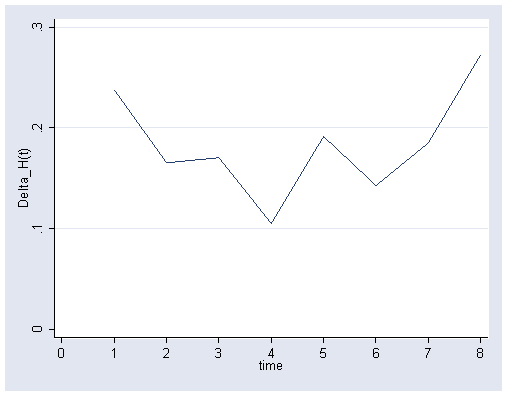
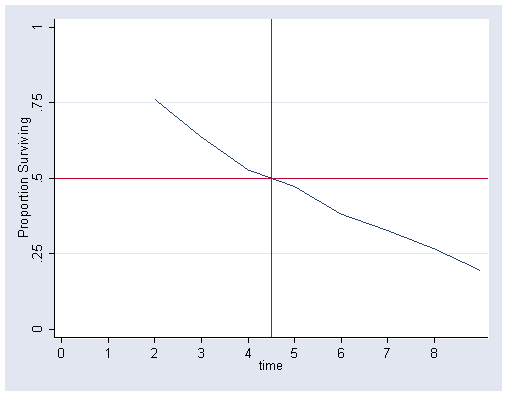
Figure 10.2, page 340.
/* Panel A */
use https://stats.idre.ucla.edu/stat/stata/examples/alda/data/relapse_days, clear

generate weeks = int(days/7) + 1
generate event = ~censor
stset weeks, failure(event)
sts generate h = h
graph twoway scatter h weeks, connect(l) msymbol(i) xlabel(0(1)12)
ltable weeks event, notable graph noconf msymbol(i) ylabel(0(.25)1) xlabel(0(1)12) yline(0.5)
/* Panel B */
use https://stats.idre.ucla.edu/stat/stata/examples/alda/data/firstsex, clear

generate event = ~censor
stset time, failure(event)
sts generate h = h
graph twoway scatter h time, connect(l) msymbol(i) xlabel(6(1)12) ylabel(0(.1).3) sort
ltable time event, notable graph noconf msymbol(i) ylabel(0(.25)1) xlabel(6(1)12) yline(0.5) xline(11.6)
/* Panel C */
use https://stats.idre.ucla.edu/stat/stata/examples/alda/data/suicide_orig, clear

generate event = ~censor
stset time, failure(event)
sts generate h = h
graph twoway scatter h time, connect(l) msymbol(i) xlabel(5(2)21) ylabel(0(.05).15) sort
ltable time event, noadjust notab graph noconf msymbol(i) ylabel(0(.25)1) xlabel(5(2)21) yline(.5) xline(15.8)
/* Panel D */
use https://stats.idre.ucla.edu/stat/stata/examples/alda/data/congress_orig, clear

generate event = ~censor
stset time, failure(event)
sts generate h = h
graph twoway scatter h time, connect(l) msymbol(i) xlabel(0(1)8) ylabel(0(.10).3) sort
ltable time event, noadjust notab graph noconf msymbol(i) ylabel(0(.25)1) xlabel(0(1)8) yline(.5) xline(4.5)
Table 10.2, page 349.
Please see table 10.1 above. The Stata commands for producing table 10.1 include standard errors that are found in table 10.2.
Figure 10.4, page 353.
use https://stats.idre.ucla.edu/stat/stata/examples/alda/data/teachers, clear

list id t censor if id==20 | id==126 | id==129, noobs

  +-------------------+
  |  id    t   censor |
  |-------------------|
  |  20    3        0 |
  | 126   12        0 |
  | 129   12        1 |
  +-------------------+

use https://stats.idre.ucla.edu/stat/stata/examples/alda/data/teachers_pp, clear

list id period event if id==20 | id==126 | id==129, noobs

  +----------------------+
  |  id   period   event |
  |----------------------|
  |  20        1       0 |
  |  20        2       0 |
  |  20        3       1 |
  | 126        1       0 |
  | 126        2       0 |
  |----------------------|
  | 126        3       0 |
  | 126        4       0 |
  | 126        5       0 |
  | 126        6       0 |
  | 126        7       0 |
  |----------------------|
  | 126        8       0 |
  | 126        9       0 |
  | 126       10       0 |
  | 126       11       0 |
  | 126       12       1 |
  |----------------------|
  | 129        1       0 |
  | 129        2       0 |
  | 129        3       0 |
  | 129        4       0 |
  | 129        5       0 |
  |----------------------|
  | 129        6       0 |
  | 129        7       0 |
  | 129        8       0 |
  | 129        9       0 |
  | 129       10       0 |
  |----------------------|
  | 129       11       0 |
  | 129       12       0 |
  +----------------------+
Note: There is a user written procedure, prsnperd.ado, that will convert a “person” data file to a “person-period” data file. You can locate the procedure by entering the command, search prsnperd, and following the installation instructions (see How can I use the search command to search for programs and get additional help? for more information about using search). The prsnperd.ado automatically generates a response variable for the event, called _Y, a period variable, _period, and dummy variables for each of the time periods.
use https://stats.idre.ucla.edu/stat/stata/examples/alda/data/teachers, clear

prsnperd id t censor
describe

Contains data from https://stats.idre.ucla.edu/stat/stata/examples/alda/data/teachers.dta
  obs:        24,875
 vars:            18
 size:     1,890,500 (63.9% of memory free)
-------------------------------------------------------------------------------
              storage  display     value
variable name   type   format      label      variable label
-------------------------------------------------------------------------------
id              float  %9.0g
t               float  %9.0g
censor          float  %9.0g
_period         float  %9.0g
_d1             float  %9.0g
_d2             float  %9.0g
_d3             float  %9.0g
_d4             float  %9.0g
_d5             float  %9.0g
_d6             float  %9.0g
_d7             float  %9.0g
_d8             float  %9.0g
_d9             float  %9.0g
_d10            float  %9.0g
_d11            float  %9.0g
_d12            float  %9.0g
_Y              float  %9.0g                  0: Event did not happen; 1:
                                                Event happened
_status         float  %9.0g                  1: Left; 2: Stayed; 3: Censored
-------------------------------------------------------------------------------
Sorted by:  id
     Note:  dataset has changed since last saved

list id _period _Y if id==20 | id==126 | id==129, noobs sepby(id)

  +--------------------+
  |  id   _period   _Y |
  |--------------------|
  |  20         1    0 |
  |  20         2    0 |
  |  20         3    1 |
  |--------------------|
  | 126         1    0 |
  | 126         2    0 |
  | 126         3    0 |
  | 126         4    0 |
  | 126         5    0 |
  | 126         6    0 |
  | 126         7    0 |
  | 126         8    0 |
  | 126         9    0 |
  | 126        10    0 |
  | 126        11    0 |
  | 126        12    1 |
  |--------------------|
  | 129         1    0 |
  | 129         2    0 |
  | 129         3    0 |
  | 129         4    0 |
  | 129         5    0 |
  | 129         6    0 |
  | 129         7    0 |
  | 129         8    0 |
  | 129         9    0 |
  | 129        10    0 |
  | 129        11    0 |
  | 129        12    0 |
  +--------------------+
Table 10.3, page 355.
use https://stats.idre.ucla.edu/stat/stata/examples/alda/data/teachers_pp, clear

tabulate period event, row

+----------------+
| Key            |
|----------------|
|   frequency    |
| row percentage |
+----------------+

           |         event
    period |         0          1 |     Total
-----------+----------------------+----------
         1 |     3,485        456 |     3,941
           |     88.43      11.57 |    100.00
-----------+----------------------+----------
         2 |     3,101        384 |     3,485
           |     88.98      11.02 |    100.00
-----------+----------------------+----------
         3 |     2,742        359 |     3,101
           |     88.42      11.58 |    100.00
-----------+----------------------+----------
         4 |     2,447        295 |     2,742
           |     89.24      10.76 |    100.00
-----------+----------------------+----------
         5 |     2,229        218 |     2,447
           |     91.09       8.91 |    100.00
-----------+----------------------+----------
         6 |     2,045        184 |     2,229
           |     91.75       8.25 |    100.00
-----------+----------------------+----------
         7 |     1,922        123 |     2,045
           |     93.99       6.01 |    100.00
-----------+----------------------+----------
         8 |     1,563         79 |     1,642
           |     95.19       4.81 |    100.00
-----------+----------------------+----------
         9 |     1,203         53 |     1,256
           |     95.78       4.22 |    100.00
-----------+----------------------+----------
        10 |       913         35 |       948
           |     96.31       3.69 |    100.00
-----------+----------------------+----------
        11 |       632         16 |       648
           |     97.53       2.47 |    100.00
-----------+----------------------+----------
        12 |       386          5 |       391
           |     98.72       1.28 |    100.00
-----------+----------------------+----------
     Total |    22,668      2,207 |    24,875
           |     91.13       8.87 |    100.00

