Table 13.1, page 471.
use https://stats.idre.ucla.edu/stat/stata/examples/alda/data/honking, clear

sort seconds
list seconds censor

       seconds     censor
  1.      1.41          1
  2.      1.41          0
  3.      1.51          0
  4.      1.67          0
  5.      1.68          0
  6.      1.86          0
  7.      2.12          0
.. output omitted ...
 50.      6.21          1
 51.       6.3          0
 52.       6.6          1
 53.       7.2          0
 54.      9.59          0
 55.     12.29          0
 56.     13.18          0
 57.     17.15          1
Table 13.2, page 477.
use https://stats.idre.ucla.edu/stat/stata/examples/alda/data/honking, clear

generate event = ~censor
ltable seconds event, noadjust intervals(0 1 2 3 4 5 6 7 8 18)

                 Beg.                                 Std.
   Interval     Total   Deaths   Lost    Survival    Error     [95% Conf. Int.]
-------------------------------------------------------------------------------
    1     2        57        5      1     0.9123    0.0375     0.8020    0.9625
    2     3        51       14      3     0.6619    0.0632     0.5224    0.7693
    3     4        34        9      2     0.4867    0.0683     0.3481    0.6117
    4     5        23        6      4     0.3597    0.0673     0.2314    0.4896
    5     6        13        2      2     0.3044    0.0674     0.1803    0.4378
    6     7         9        2      2     0.2367    0.0673     0.1199    0.3757
    7     8         5        1      0     0.1894    0.0685     0.0783    0.3373
    8    18         4        3      1     0.0473    0.0444     0.0038    0.1884
-------------------------------------------------------------------------------

ltable seconds event, noadjust hazard intervals(0 1 2 3 4 5 6 7 8 18)

                 Beg.     Cum.     Std.                Std.
   Interval     Total   Failure   Error    Hazard     Error    [95% Conf. Int.]
-------------------------------------------------------------------------------
    1     2        57    0.0877  0.0375    0.0877    0.0392    0.0285    0.1797
    2     3        51    0.3381  0.0632    0.2745    0.0734    0.1501    0.4359
    3     4        34    0.5133  0.0683    0.2647    0.0882    0.1210    0.4636
    4     5        23    0.6403  0.0673    0.2609    0.1065    0.0957    0.5073
    5     6        13    0.6956  0.0674    0.1538    0.1088    0.0186    0.4286
    6     7         9    0.7633  0.0673    0.2222    0.1571    0.0269    0.6191
    7     8         5    0.8106  0.0685    0.2000    0.2000    0.0051    0.7378
    8    18         4    0.9527  0.0444    0.0750    0.0433    0.0155    0.1806
-------------------------------------------------------------------------------

ltable seconds event, intervals(0 1 2 3 4 5 6 7 8 18)

                 Beg.                                 Std.
   Interval     Total   Deaths   Lost    Survival    Error     [95% Conf. Int.]
-------------------------------------------------------------------------------
    1     2        57        5      1     0.9115    0.0378     0.8004    0.9622
    2     3        51       14      3     0.6537    0.0643     0.5121    0.7633
    3     4        34        9      2     0.4754    0.0690     0.3362    0.6021
    4     5        23        6      4     0.3396    0.0680     0.2116    0.4719
    5     6        13        2      2     0.2830    0.0674     0.1608    0.4181
    6     7         9        2      2     0.2122    0.0666     0.0998    0.3526
    7     8         5        1      0     0.1698    0.0654     0.0662    0.3140
    8    18         4        3      1     0.0243    0.0331     0.0005    0.1634
-------------------------------------------------------------------------------

ltable seconds event, hazard intervals(0 1 2 3 4 5 6 7 8 18)

                 Beg.     Cum.     Std.                Std.
   Interval     Total   Failure   Error    Hazard     Error    [95% Conf. Int.]
-------------------------------------------------------------------------------
    1     2        57    0.0885  0.0378    0.0926    0.0414    0.0115    0.1737
    2     3        51    0.3463  0.0643    0.3294    0.0868    0.1592    0.4996
    3     4        34    0.5246  0.0690    0.3158    0.1039    0.1121    0.5195
    4     5        23    0.6604  0.0680    0.3333    0.1342    0.0703    0.5963
    5     6        13    0.7170  0.0674    0.1818    0.1280    0.0000    0.4328
    6     7         9    0.7878  0.0666    0.2857    0.2000    0.0000    0.6776
    7     8         5    0.8302  0.0654    0.2222    0.2208    0.0000    0.6551
    8    18         4    0.9757  0.0331    0.1500    0.0573    0.0377    0.2623
-------------------------------------------------------------------------------
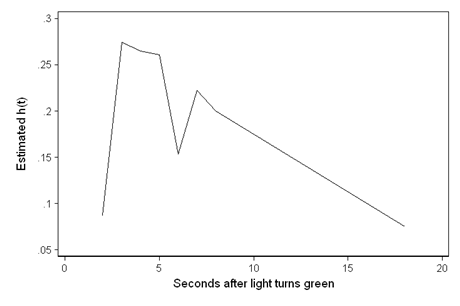
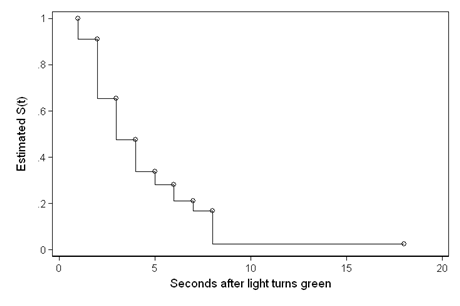
Figure 13.1, page 479.
use https://stats.idre.ucla.edu/stat/stata/examples/alda/data/honking, clear
gen event = ~censor
ltable seconds event, noadjust intervals(0 1 2 3 4 5 6 7 8 18) saving(ltable1)
use ltable1, clear
set obs 9
replace t1 = 1 if _n==9
replace survival = 1 if _n==9
sort t1
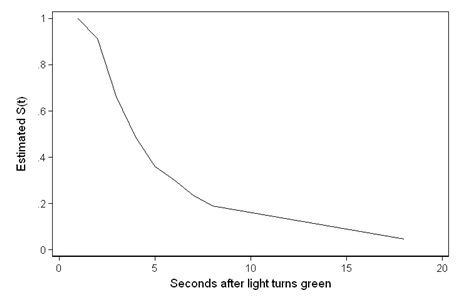
twoway (line survival t1), xtitle("Seconds after light turns green") ytitle("Estimated S(t)") xlabel(0(5)20)
 twoway (line hazard t1), xtitle("Seconds after light turns green") ytitle("Estimated h(t)") xlabel(0(5)20)
 use https://stats.idre.ucla.edu/stat/stata/examples/alda/data/honking, clear
gen event = ~censor
ltable seconds event, intervals(0 1 2 3 4 5 6 7 8 18) saving(ltable2)
use ltable2, clear
set obs 9
replace t1 = 1 if _n==9
replace survival = 1 if _n==9
sort t1
twoway scatter survival t1, connect(stepstair) ///
xtitle("Seconds after light turns green") ytitle("Estimated S(t)")
use https://stats.idre.ucla.edu/stat/stata/examples/alda/data/honking, clear
gen event = ~censor
ltable seconds event, intervals(0 1 2 3 4 5 6 7 8 18) saving(ltable2)
use ltable2, clear
set obs 9
replace t1 = 1 if _n==9
replace survival = 1 if _n==9
sort t1
twoway scatter survival t1, connect(stepstair) ///
xtitle("Seconds after light turns green") ytitle("Estimated S(t)")
 twoway scatter hazard t1, connect(stepstair) ///
xtitle("Seconds after light turns green") ytitle("Estimated h(t)")
twoway scatter hazard t1, connect(stepstair) ///
xtitle("Seconds after light turns green") ytitle("Estimated h(t)")
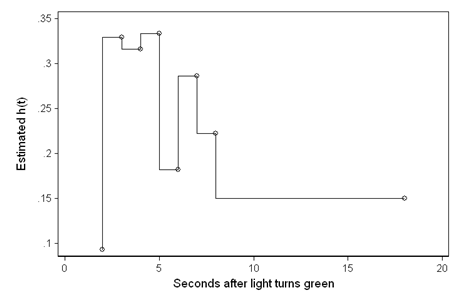
Table 13.3, page 484.
use https://stats.idre.ucla.edu/stat/stata/examples/alda/data/honking, clear

generate event = ~censor
stset seconds, failure(event)

sts list

         failure _d:  event
   analysis time _t:  seconds

           Beg.          Net            Survivor      Std.
  Time    Total   Fail   Lost           Function     Error     [95% Conf. Int.]
-------------------------------------------------------------------------------
  1.41       57      1      1             0.9825    0.0174     0.8819    0.9975
  1.51       55      1      0             0.9646    0.0246     0.8657    0.9910
  1.67       54      1      0             0.9467    0.0299     0.8439    0.9825
  1.68       53      1      0             0.9289    0.0343     0.8215    0.9727
  1.86       52      1      0             0.9110    0.0380     0.7993    0.9620
  2.12       51      1      0             0.8931    0.0412     0.7775    0.9505
  2.19       50      1      0             0.8753    0.0441     0.7561    0.9385
  2.36       49      0      1             0.8753    0.0441     0.7561    0.9385
  2.48       48      1      0             0.8570    0.0468     0.7344    0.9258
   2.5       47      1      0             0.8388    0.0492     0.7130    0.9127
  2.53       46      1      0             0.8206    0.0514     0.6921    0.8992
  2.54       45      1      0             0.8023    0.0534     0.6715    0.8854
  2.56       44      1      0             0.7841    0.0552     0.6511    0.8712
  2.62       43      1      0             0.7659    0.0569     0.6311    0.8568
  2.68       42      1      0             0.7476    0.0584     0.6113    0.8421
  2.76       41      0      1             0.7476    0.0584     0.6113    0.8421
  2.78       40      0      1             0.7476    0.0584     0.6113    0.8421
  2.83       39      1      0             0.7285    0.0599     0.5903    0.8266
  2.88       38      1      0             0.7093    0.0614     0.5697    0.8108
  2.89       37      1      0             0.6901    0.0626     0.5493    0.7948
  2.92       36      1      0             0.6710    0.0637     0.5292    0.7786
  2.98       35      1      0             0.6518    0.0647     0.5094    0.7621
...
  3.57       26      1      0             0.5121    0.0692     0.3701    0.6372
  3.58       25      1      0             0.4916    0.0694     0.3506    0.6181
...
  4.96       14      1      0             0.3349    0.0683     0.2067    0.4681
  5.12       13      0      1             0.3349    0.0683     0.2067    0.4681
  5.39       12      1      0             0.3070    0.0681     0.1815    0.4416
  5.73       11      1      0             0.2791    0.0674     0.1574    0.4144
  5.88       10      0      1             0.2791    0.0674     0.1574    0.4144
  6.03        9      1      0             0.2481    0.0666     0.1308    0.3846
  6.21        8      0      1             0.2481    0.0666     0.1308    0.3846
   6.3        7      1      0             0.2126    0.0659     0.1011    0.3514
   6.6        6      0      1             0.2126    0.0659     0.1011    0.3514
   7.2        5      1      0             0.1701    0.0650     0.0670    0.3133
  9.59        4      1      0             0.1276    0.0611     0.0388    0.2711
 12.29        3      1      0             0.0851    0.0535     0.0172    0.2244
 13.18        2      1      0             0.0425    0.0403     0.0034    0.1730
 17.15        1      0      1             0.0425    0.0403     0.0034    0.1730
-------------------------------------------------------------------------------
Figure 13.2, page 485. We are only able to generate the top plot for now.
use https://stats.idre.ucla.edu/stat/stata/examples/alda/data/honking, clear
gen event = ~censor
stset seconds, failure(event)
sts graph
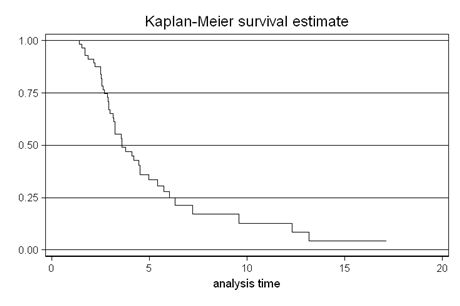
Figure 13.4, page 493.
use https://stats.idre.ucla.edu/stat/stata/examples/alda/data/honking, clear
gen event = ~censor

stset seconds, failure(event)
sts generate surv = s nelson = na

gen nlsurv = -log(surv)

sort seconds
twoway (scatter nelson seconds, connect(stepstair) lpattern(solid) msize(zero)) ///
(scatter nlsurv seconds, connect(stepstair) lpattern(dash) msize(zero)), ///
xtitle("Seconds after light turns green") ytitle("Estimated H(t)") ///
legend(ring(0) pos(5) lab(1 "Nelson-Aalen") lab(2 "Negative Log Survival"))
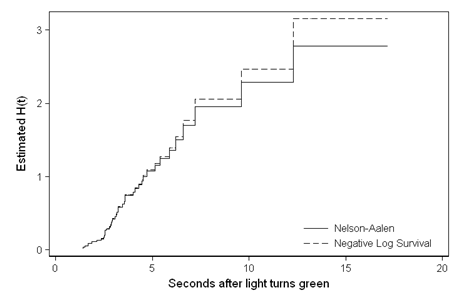
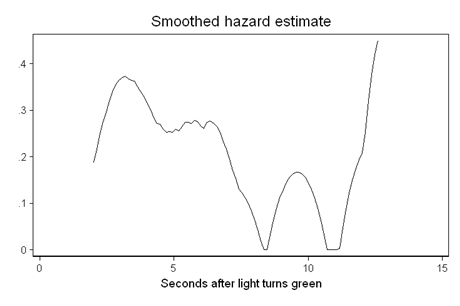
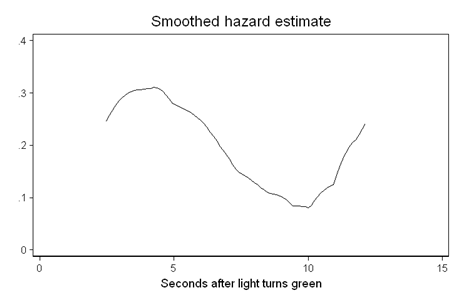
Figure 13.5, page 496. Our graphs do not exactly match those in the book, most likely due to a difference in kernel functions.
use https://stats.idre.ucla.edu/stat/stata/examples/alda/data/honking, clear
gen event = ~censor
stset seconds, failure(event)

sts graph, haz width(.5) ylabel(0(.1).4) xtitle("Seconds after light turns green")


sts graph, haz width(1) ylabel(0(.1).4) xtitle("Seconds after light turns green")


sts graph, haz width(1.5) ylabel(0(.1).4) xtitle("Seconds after light turns green")
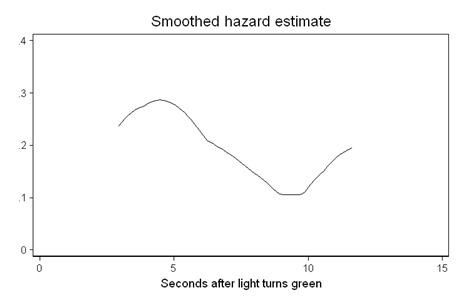
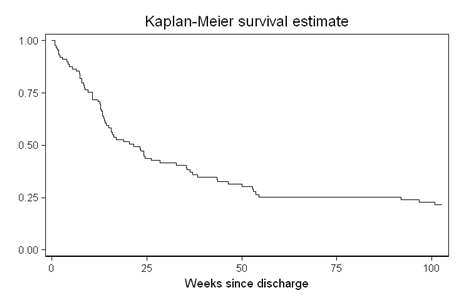
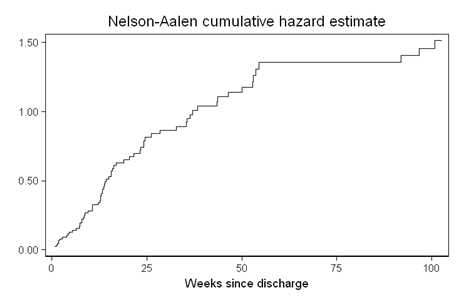
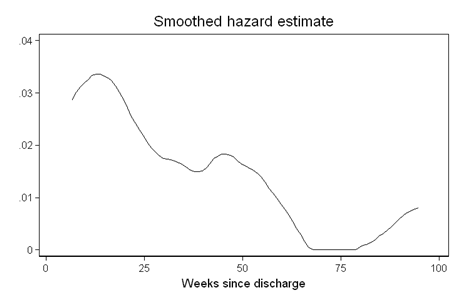
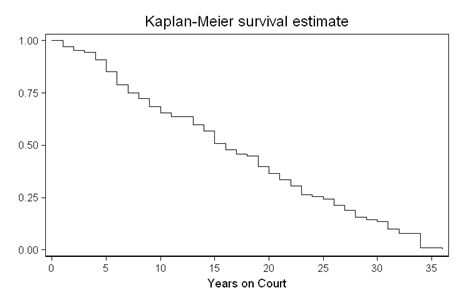
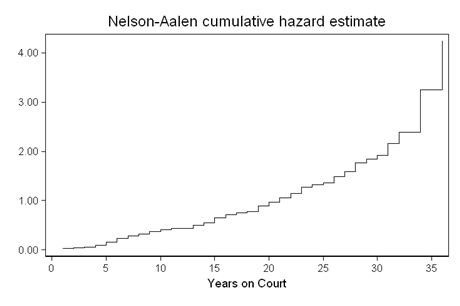
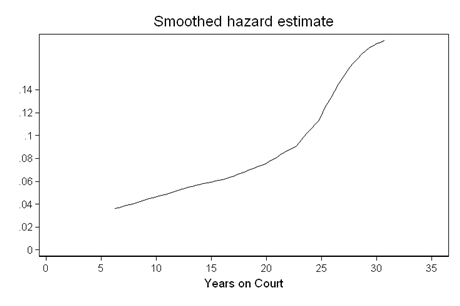
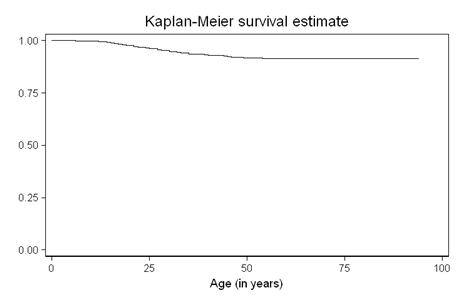
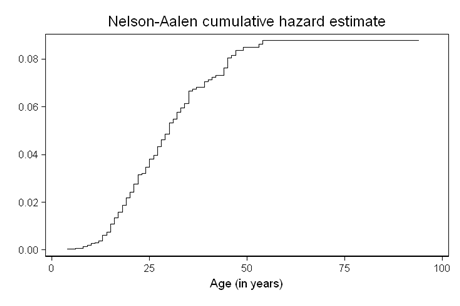
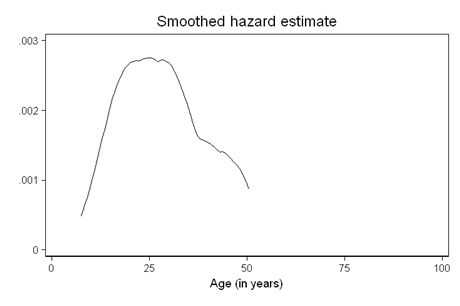
Figure 13.6, page 499. Again, due to a difference in kernel functions, our smoothed hazard graphs do not exactly match those in the text.
/* Column 1 */
use https://stats.idre.ucla.edu/stat/stata/examples/alda/data/alcohol_relapse, clear
gen event = ~censor
stset weeks, failure(event)
sts graph, xtitle("Weeks since discharge") legend(ring(0) pos(2)) xlabel(0(25)100) ylabel(,nogrid) scheme(Lean1)
sts graph, cumh xtitle("Weeks since discharge") legend(ring(0) pos(5)) xlabel(0(25)100) ylabel(,nogrid) scheme(Lean1)
sts graph, haz width(6) xtitle("Weeks since discharge") legend(ring(0) pos(5)) xlabel(0(25)100) ylabel(,nogrid) scheme(Lean1)
 /* Column 2 */
use https://stats.idre.ucla.edu/stat/stata/examples/alda/data/judges, clear
stset tenure, failure(leave)
sts graph, xtitle("Years on Court") legend(ring(0) pos(2)) xlabel(0(5)35) ylabel(,nogrid) scheme(Lean1)
sts graph, cumh xtitle("Years on Court") legend(ring(0) pos(5)) xlabel(0(5)35) ylabel(,nogrid) scheme(Lean1)
sts graph, haz width(5) xtitle("Years on Court") legend(ring(0) pos(5)) xlabel(0(5)35) ylabel(0(.02).14,nogrid) scheme(Lean1)
/* Column 2 */
use https://stats.idre.ucla.edu/stat/stata/examples/alda/data/judges, clear
stset tenure, failure(leave)
sts graph, xtitle("Years on Court") legend(ring(0) pos(2)) xlabel(0(5)35) ylabel(,nogrid) scheme(Lean1)
sts graph, cumh xtitle("Years on Court") legend(ring(0) pos(5)) xlabel(0(5)35) ylabel(,nogrid) scheme(Lean1)
sts graph, haz width(5) xtitle("Years on Court") legend(ring(0) pos(5)) xlabel(0(5)35) ylabel(0(.02).14,nogrid) scheme(Lean1)
 /* Column 3 */
use https://stats.idre.ucla.edu/stat/stata/examples/alda/data/firstdepression, clear
gen event = ~censor
stset age, failure(event)
sts graph, xtitle("Age (in years)") legend(ring(0) pos(2)) xlabel(0(25)100) ylabel(,nogrid) scheme(Lean1)
sts graph, cumh xtitle("Age (in years)") legend(ring(0) pos(5)) xlabel(0(25)100) ylabel(,nogrid) scheme(Lean1)
sts graph, haz width(3.5) xtitle("Age (in years)") legend(ring(0) pos(5)) xlabel(0(25)100) ylabel(0(.001).003,nogrid) scheme(Lean1)
/* Column 3 */
use https://stats.idre.ucla.edu/stat/stata/examples/alda/data/firstdepression, clear
gen event = ~censor
stset age, failure(event)
sts graph, xtitle("Age (in years)") legend(ring(0) pos(2)) xlabel(0(25)100) ylabel(,nogrid) scheme(Lean1)
sts graph, cumh xtitle("Age (in years)") legend(ring(0) pos(5)) xlabel(0(25)100) ylabel(,nogrid) scheme(Lean1)
sts graph, haz width(3.5) xtitle("Age (in years)") legend(ring(0) pos(5)) xlabel(0(25)100) ylabel(0(.001).003,nogrid) scheme(Lean1)
 /* Column 4 */
use https://stats.idre.ucla.edu/stat/stata/examples/alda/data/healthworkers, clear
gen event = ~censor
stset weeks, failure(event)
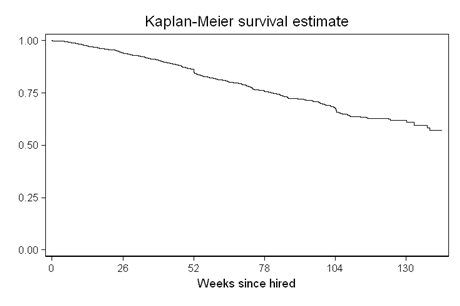
sts graph, xtitle("Weeks since hired") legend(ring(0) pos(2)) xlabel(0(26)130) ylabel(,nogrid) scheme(Lean1)
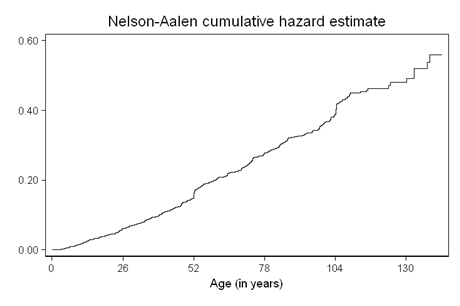
sts graph, cumh xtitle("Age (in years)") legend(ring(0) pos(5)) xlabel(0(26)130) ylabel(,nogrid) scheme(Lean1)
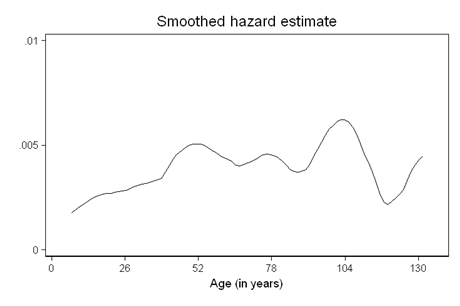
sts graph, haz width(6) xtitle("Age (in years)") legend(ring(0) pos(5)) xlabel(0(26)130) ylabel(0(.005).01,nogrid) scheme(Lean1)
/* Column 4 */
use https://stats.idre.ucla.edu/stat/stata/examples/alda/data/healthworkers, clear
gen event = ~censor
stset weeks, failure(event)
sts graph, xtitle("Weeks since hired") legend(ring(0) pos(2)) xlabel(0(26)130) ylabel(,nogrid) scheme(Lean1)
sts graph, cumh xtitle("Age (in years)") legend(ring(0) pos(5)) xlabel(0(26)130) ylabel(,nogrid) scheme(Lean1)
sts graph, haz width(6) xtitle("Age (in years)") legend(ring(0) pos(5)) xlabel(0(26)130) ylabel(0(.005).01,nogrid) scheme(Lean1)